Gold talking points:
- Gold prices have been mean-reverting over the past few weeks, caught between longer-term support and resistance.
- This week brings the Fed and this might finally give gold prices the motivation to move. The longer-term backdrop brings bearish potential, but shorter-term strength remains a possible scenario around FOMC’s Wednesday meeting.
- The analysis contained in article relies on price action and chart formations. To learn more about price action or chart patterns, check out our DailyFX Education section.
Gold prices have been very quiet over the past three weeks, but that may come to a head this week as a number of drivers sit on the economic calendar. Of course, the big item is the FOMC rate decision on Wednesday and logically this is where that next move from Gold will begin to develop, although curveballs have been known to happen and with as much event risk that this week’s calendar offers, and there’s a number of possible scenarios that can develop here.
To be sure, the FOMC has been a major push point around Gold prices, with greater rate hike potential bringing lower gold prices, and the prospect of a slower lift off bringing higher prices. The most recent major move in Gold was on November 18th, the morning that word began to spread that Jerome Powell had been re-nominated for a second term atop the bank. After touching 1876 resistance a couple of days earlier, gold prices plummeted all the way down to the 1770 support level, where it’s largely held since coming into play on November 30th.
Along the way, gold prices breached the bottom of a bear flag formation, but after that Fibonacci level came into help hold the lows, the market hasn’t been able to pose any significant trends, with price action largely bound between 1770 and 1792 for much of this time.
Gold Daily Price Chart
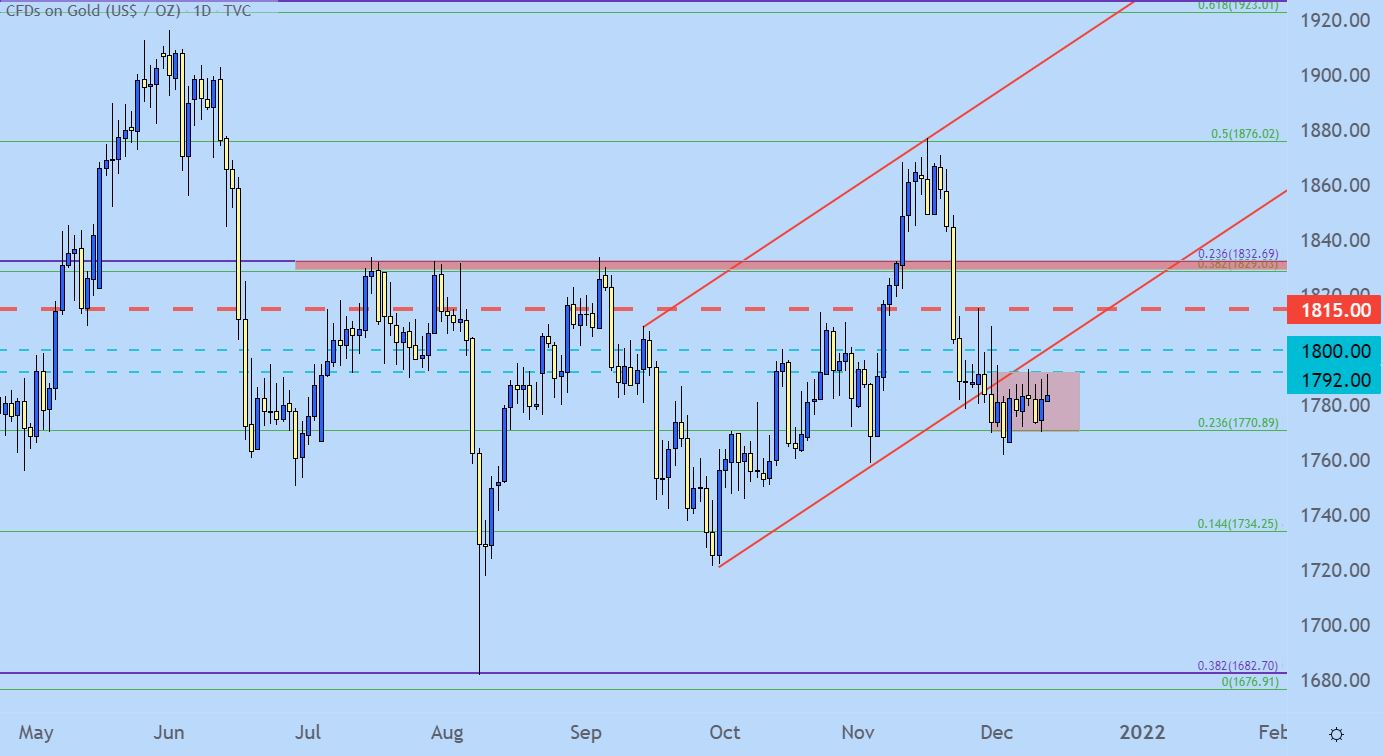
Chart prepared by James Stanley; Gold on Tradingview
Gold Drivers
While gold prices have been very responsive to hints of higher rates, price action in Gold hasn’t really been the same since last November 9th, when news of vaccines began to make their way into markets. At that point, it seemed that a bit of certainty had entered the equation about when Covid might be a more-managed risk. Or, at the least, when the Fed might come to an end of the brutal uncertainty that helped to trigger numerous massive liquidity programs.
And syncing up the bigger picture in gold – gold prices topped around the same time that Treasury yields began to climb, around the first week of August, 2020.
So, while inflation can bring a quick blip of strength to gold prices, it’s the prospect of low rates for longer that really excites the long side of the move. Negative real rates can be especially helpful for gold as this erodes purchasing power of fiat currencies which can further help to drive price gains in non-fiat instruments.
But, with a Fed seemingly at a turning point for rate policy with the expectation that this Wednesday’s dot plot matrix contains plans for more hikes in 2022, the longer-term bullish theme in gold may have to continue to take a back seat.
From a technical standpoint, there’s a recent floor of support from 1680-1700 that’s so far held the lows through three separate tests in 2021 trade. This can keep the focus on the bearish side of the argument from a long-term perspective.
Gold Weekly Price Chart
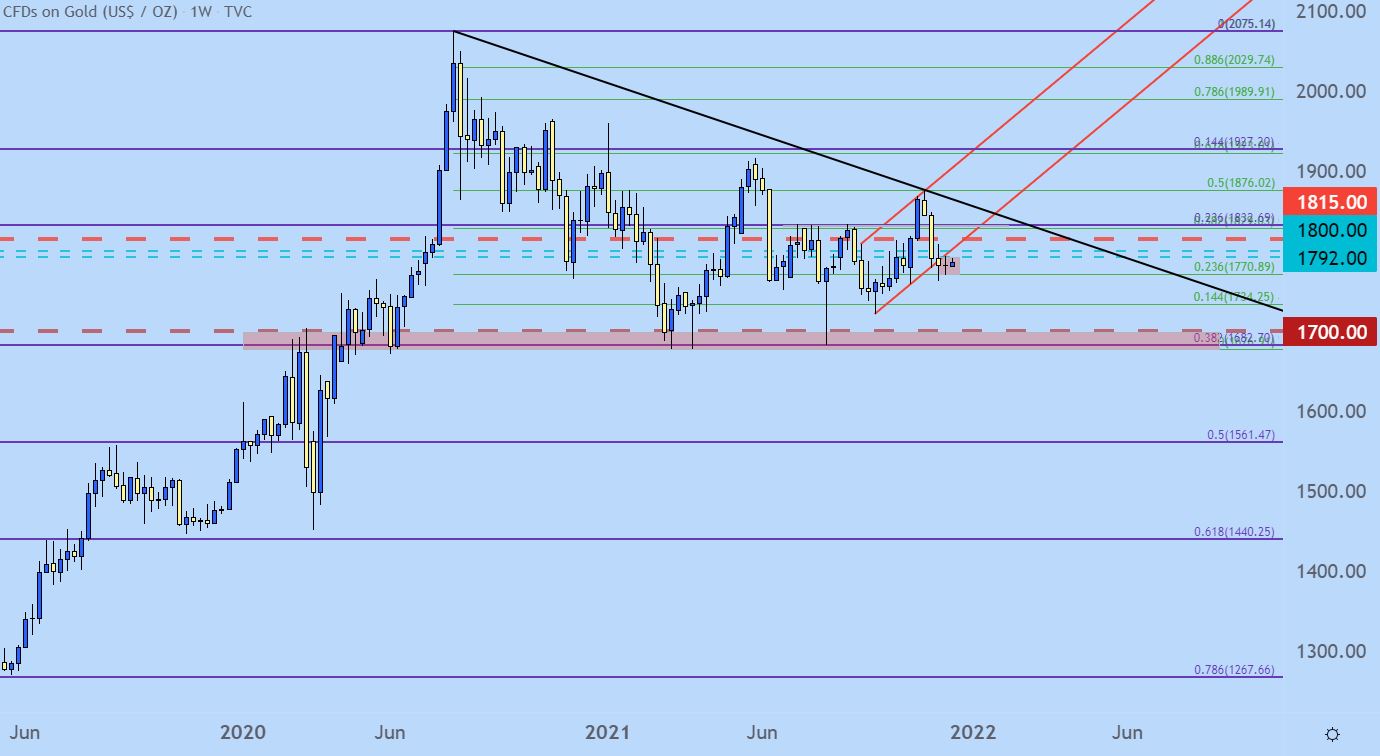
Chart prepared by James Stanley; Gold on Tradingview
Is This Wednesday the Big Break?
While the backdrop does remain open for bearish themes, with price action holding below a recently broken bear flag formation and with the longer-term setup taking on the form a descending triangle, the technical potential does remain.
The bigger question is one of fundamental drivers, and this would likely need to come from a very hawkish FOMC and a dot plot matrix containing plans for three or more hikes in 2022. At this stage, markets have already started to price in more than one hike, so if gold prices are going to break down the bank will likely need to surprise on the hawkish side to elicit that bearish move in gold.
On the other side of the matter, however, there could be short-term bullish potential, similar to what I had written about last week. The range that I was looking at for that article, with resistance holding around 1792, remains in-play today. So this short-term bullish breakout potential can open the door for more attractive entries in the longer-term bearish setup in gold prices. Next resistance can be sought out around the 1800 psychological level, followed by the 1815 swing-high.
Gold Four-Hour Price Chart
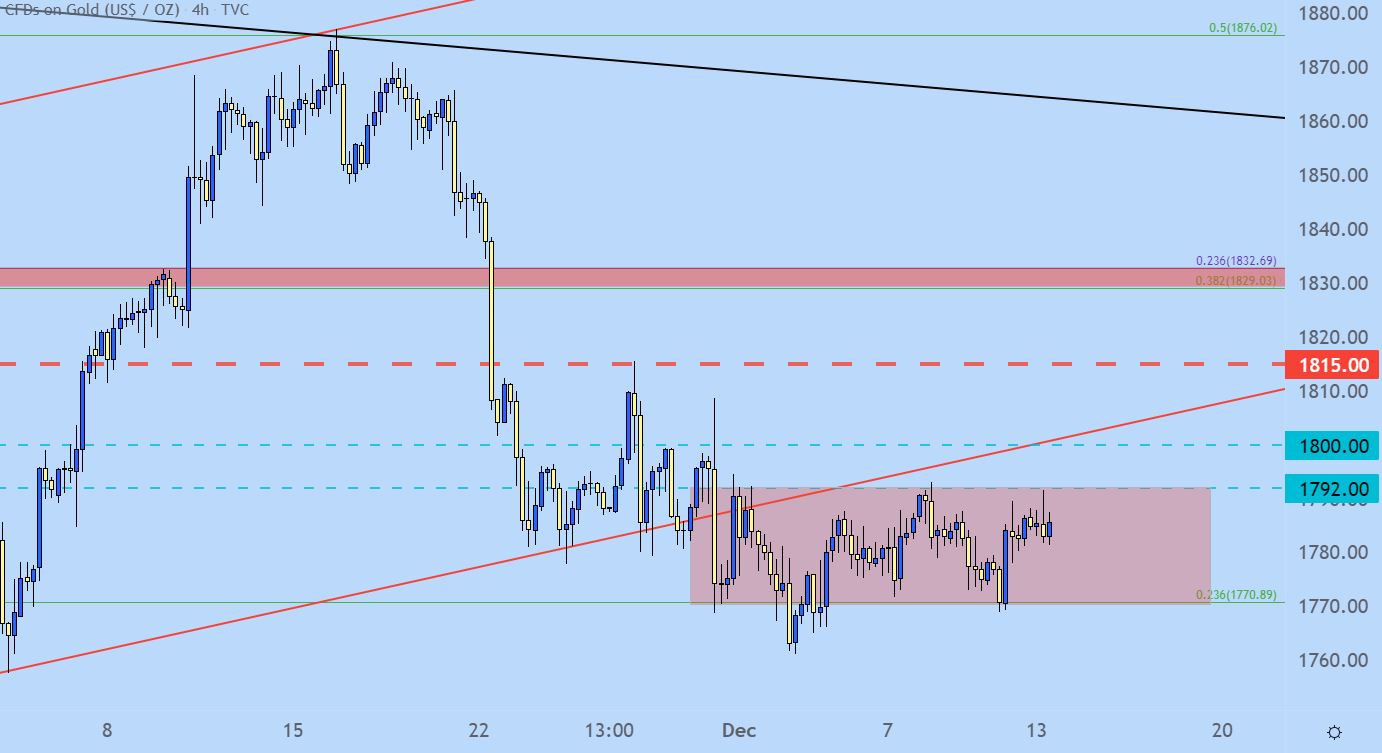
Chart prepared by James Stanley; Gold on Tradingview
— Written by James Stanley, Senior Strategist for DailyFX.com
Contact and follow James on Twitter: @JStanleyFX
Buka akaun dagangan patuh syariah anda di Weltrade.
Source link