US Dollar, EUR/USD, GBP/USD, AUD/USD, USD/CAD Talking Points:
The US Dollar is running higher as stocks continue to get slammed ahead of the January FOMC rate decision. The fear is that the Fed is nearing a hawkish pivot with unknown consequence. The bank said they were looking at a possible 2-3 rate hikes in 2022 at the December rate decision. Since then, we’ve seen comments from both US President Joe Biden and Treasury Secretary Janet Yellen regarding the Fed’s need to get in-front of inflation, which just printed at a 40-year high earlier in January.
With that, markets have continued to project tightening out of the FOMC this year to the point where many are starting to ask whether the bank will go directly into a strategy of Quantitative Tightening. The last time the Fed was tightening policy it took them years from the end of QE to begin QT; and then QT only lasted for a couple of years until markets invariably tipped-over again in late 2018.
On the topic of rates, markets are also gearing up for much more tightening than the Fed has forecast, with rates markets pricing in a median of four hikes this year, with a 33.2% probability of five or more hikes this year. This would be quite the change of pace from the loose and passive Fed that the world has become accustomed to since the Global Financial Collapse.
The US Dollar is bid in anticipation of the Wednesday FOMC meeting. The Greenback has now clawed back the entirety of the sell-off from two weeks ago, which came in right after that 7% CPI print. As I had highlighted in the immediate aftermath, the USD had quickly become oversold on the four-hour chart. That indicator is now nearing overbought territory with a little over 48 hours to the FOMC announcement.
US Dollar Four-Hour Price Chart
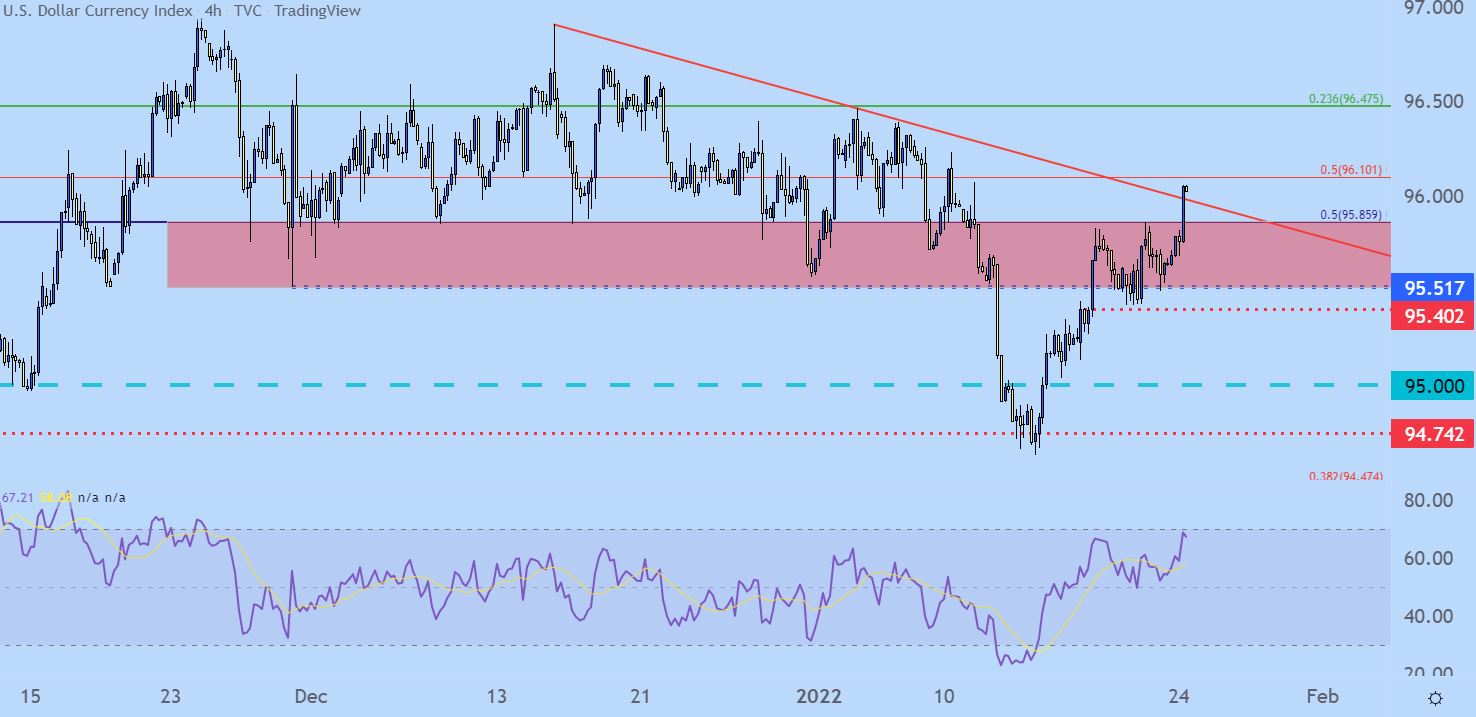
Chart prepared by James Stanley; USD, DXY on Tradingview
EUR/USD Possible Bear Trap
As mentioned numerous times over the past year, it’s going to be difficult for the USD to pose a lasting move without at least some participation from the Euro.
And as USD strength has come back, that’s reflected in EUR/USD. But, as this recent breakout has extended beyond the trendline looked at above, EUR/USD has started to show some reticence as it nears a major spot of support on the chart around the 1.1187-1.1212 zone.
That zone came into play in late-November and since, bears have avoided a re-test, helping to form an ascending triangle that eventually led to a bullish breakout around that CPI report two weeks ago. But, after finding resistance in the 1448-1500 zone, sellers have been in-control.
At this point, the 1.1300 level is coming into play and below that is another support level of note before the ‘big’ zone comes into play, and that’s at 1.1272.
Given the proximity to major support combined with the hesitation from sellers at support, this may be setting a bear trap ahead of the Fed.
EUR/USD Four-Hour Price Chart
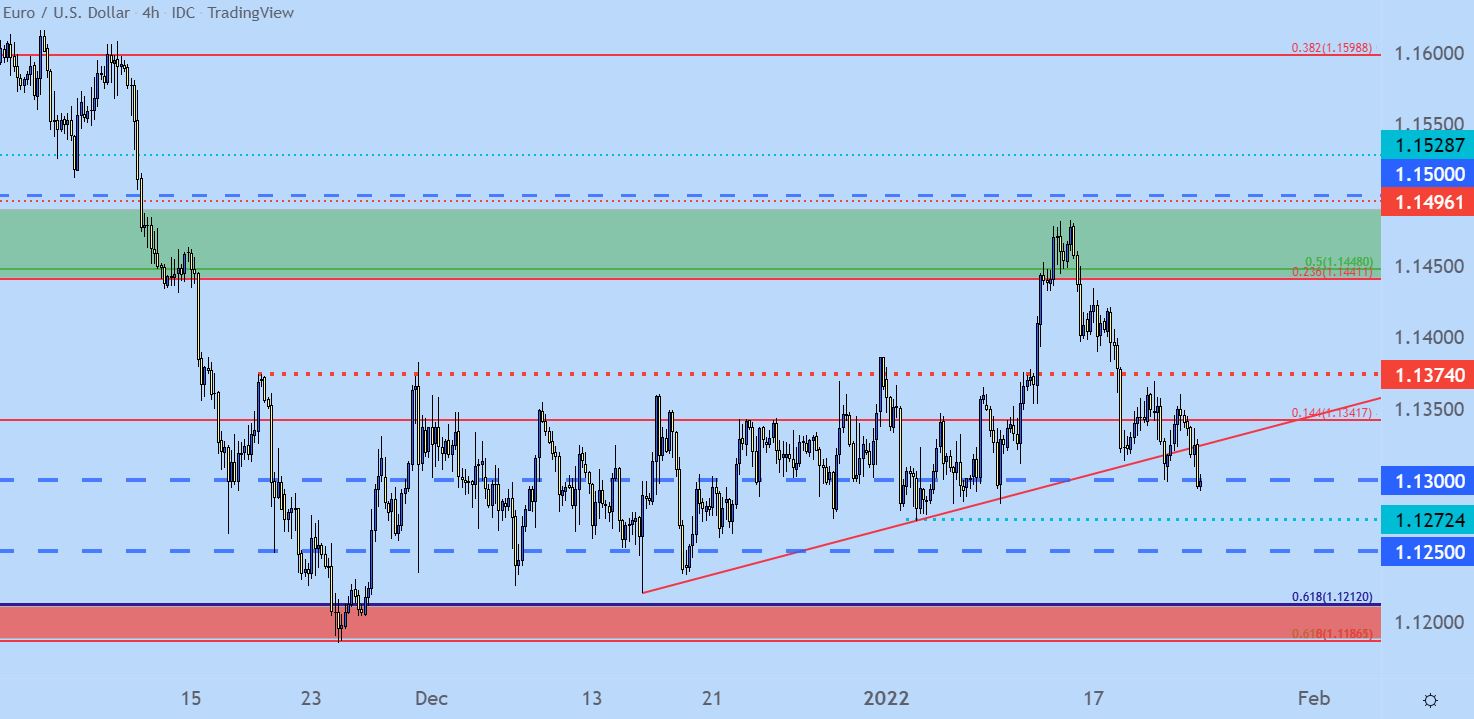
Chart prepared by James Stanley; EURUSD on Tradingview
GBP/USD Gives it Up
GBP/USD was holding onto a strong bullish trend that extended during that CPI-fueled USD sell-off. And afterwards it even gave a pullback to a spot of support that I was following, taken from bull flag resistance that was confluent with a Fibonacci level at 1.3581.
That support was slammed through, however, and prices are now back within the bearish channel that makes up that flag formation, slicing through the psychological level at 1.3500.
This seems to be what’s really fueling that USD breakout considering the tepid price action shown in EUR/USD above.
The next major support on my chart is at 1.3412, taken from a prior swing-low turned swing-high.
GBP/USD Daily Price Chart
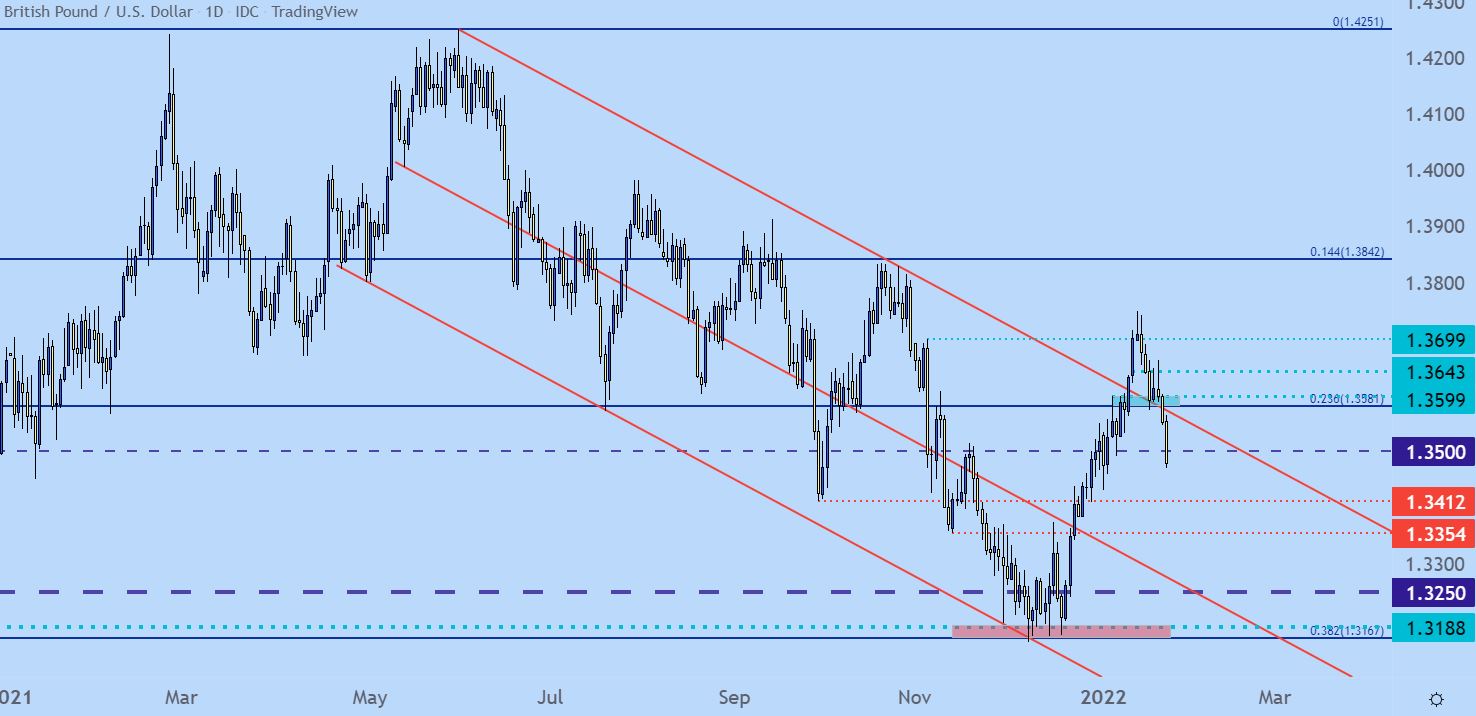
Chart prepared by James Stanley; GBPUSD on Tradingview
AUD/USD Sellers Stretch
One pair that may have some additional lure for USD bulls is AUD/USD.
AUD/USD was in a hard and fast sell-off into early-December, with prices finally finding support at the .7000 big figure. And then for the next six weeks the pair built-in a rising wedge formation.
That setup started to fill-in early last week and then a quick flare up to resistance around rising wedge support, confluent with a Fibonacci level at .7275. Since then, sellers have made a concerted push back into the equation and are now holding prices at a fresh low.
This can keep the door open for bearish strategies, looking for prices to re-test the big figure at .7000. Short-term resistance can be sought nearby around .7133 or a little higher in the zone around the .7200 handle.
AUD/USD Eight-Hour Price Chart
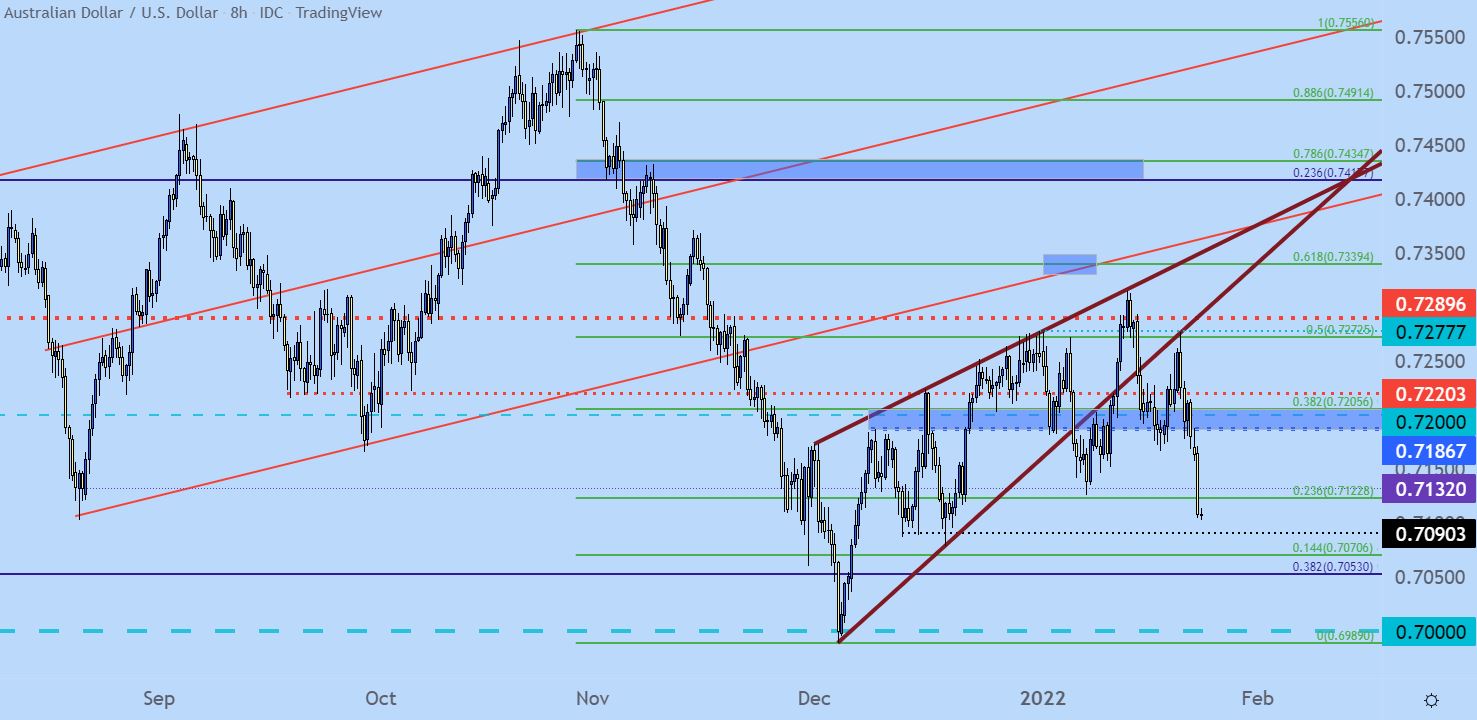
Chart prepared by James Stanley; AUDUSD on Tradingview
USD/CAD Re-Engages with Resistance (at Prior Support)
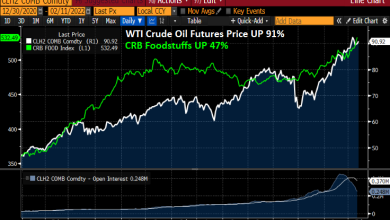
As oil prices continue to pull back, so does the Canadian Dollar.
This Wednesday also brings a BoC rate decision to go along with that Fed meeting. The Bank of Canada is widely-expected to hike there and many market participants expect even more tightening out of the BoC this year than the Fed.
I had looked into the Canadian Dollar in this week’s forecast, looking for strength in CAD in CAD/JPY. USD/CAD, however, is testing a significant zone on the chart. This zone runs from 1.2622-1.2672 and this is the area that was holding support in the pair early last year, soon becoming resistance and then support again.
Now – it’s back as resistance and this time there’s a new level involved, with the 38.2 retracement of the recent sell-off plotted at 1.2646.
USD/CAD Four-Hour Price Chart
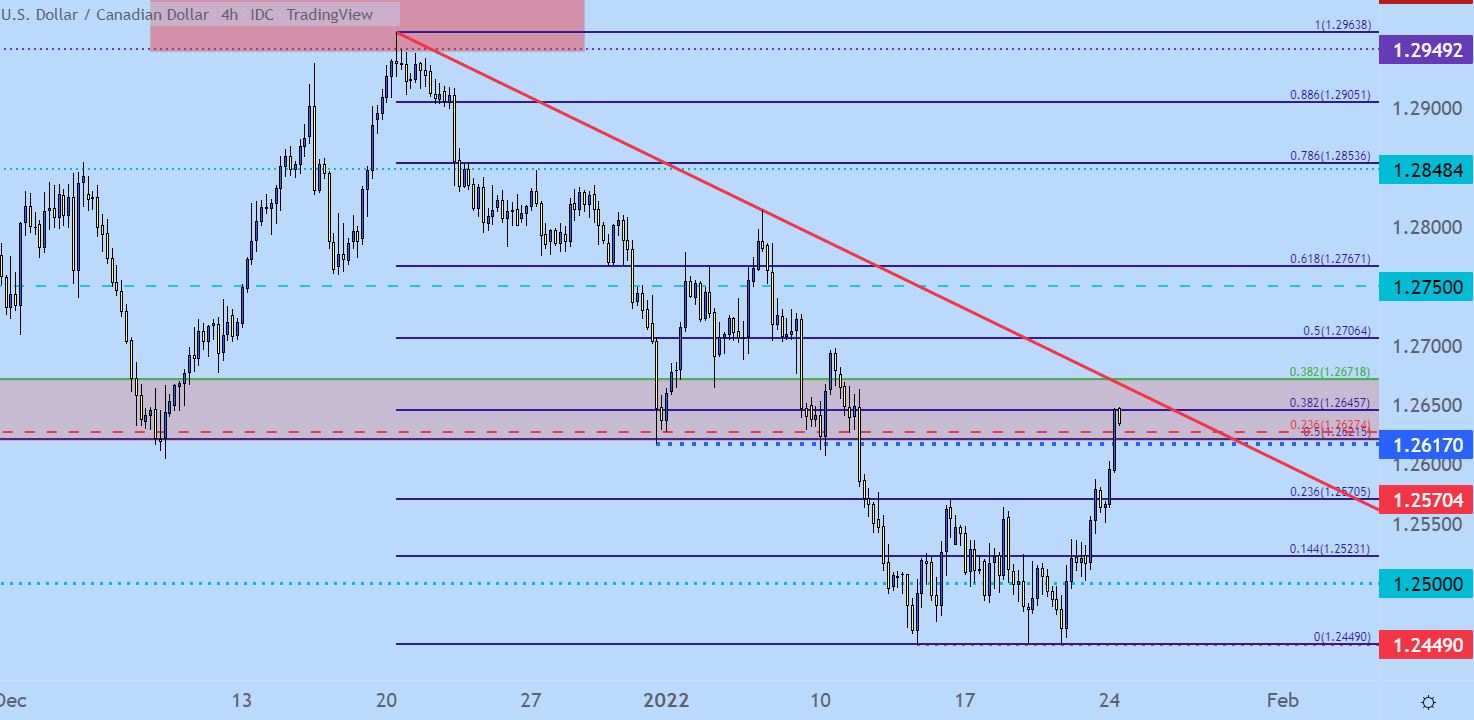
Chart prepared by James Stanley; USDCAD on Tradingview
USD/CAD Levels
The topside of this resistance zone is at 1.2672 – but if bulls can force a break then the longer-term range becomes more attractive. But, until that 2672 level is taken-out, the door remains open for fades here, looking for a pullback towards 1.2600, 1.2570 and then the 1.2500 psychological level.
USD/CAD Daily Price Chart
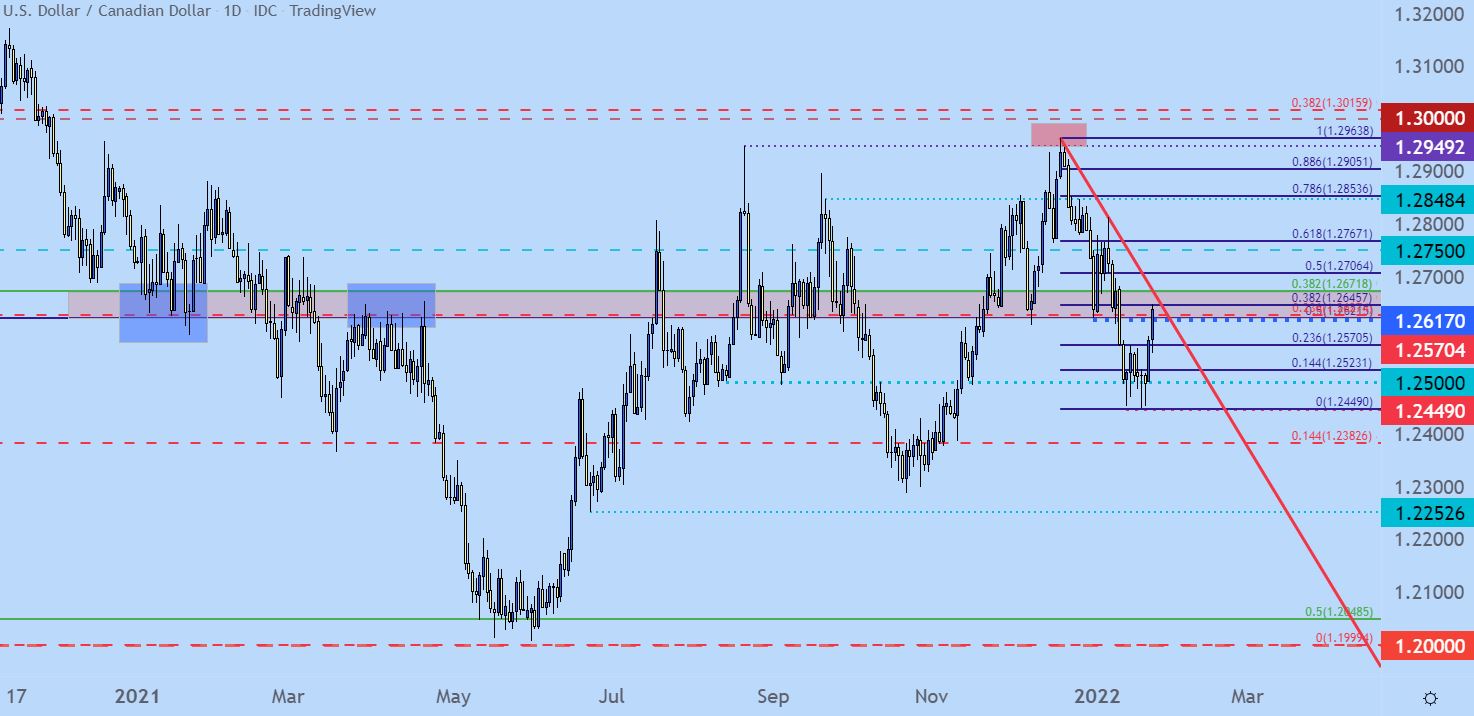
Chart prepared by James Stanley; USDCAD on Tradingview
— Written by James Stanley, Senior Strategist for DailyFX.com
Contact and follow James on Twitter: @JStanleyFX
Buka akaun dagangan patuh syariah anda di Weltrade.
Source link