
The Treasury increased the total debt by $27B in June. Activity slowed in the latest month across all instruments, but particularly the conversion of short-term to long-term. After massive moves to extend debt maturity and shrink short-term debt by $530B over 4 months (shown below by the large negative turquoise bars), July went very quiet.
Note: Non-Marketable consists almost entirely of debt the government owes to itself (e.g., debt owed to Social Security or public retirement)
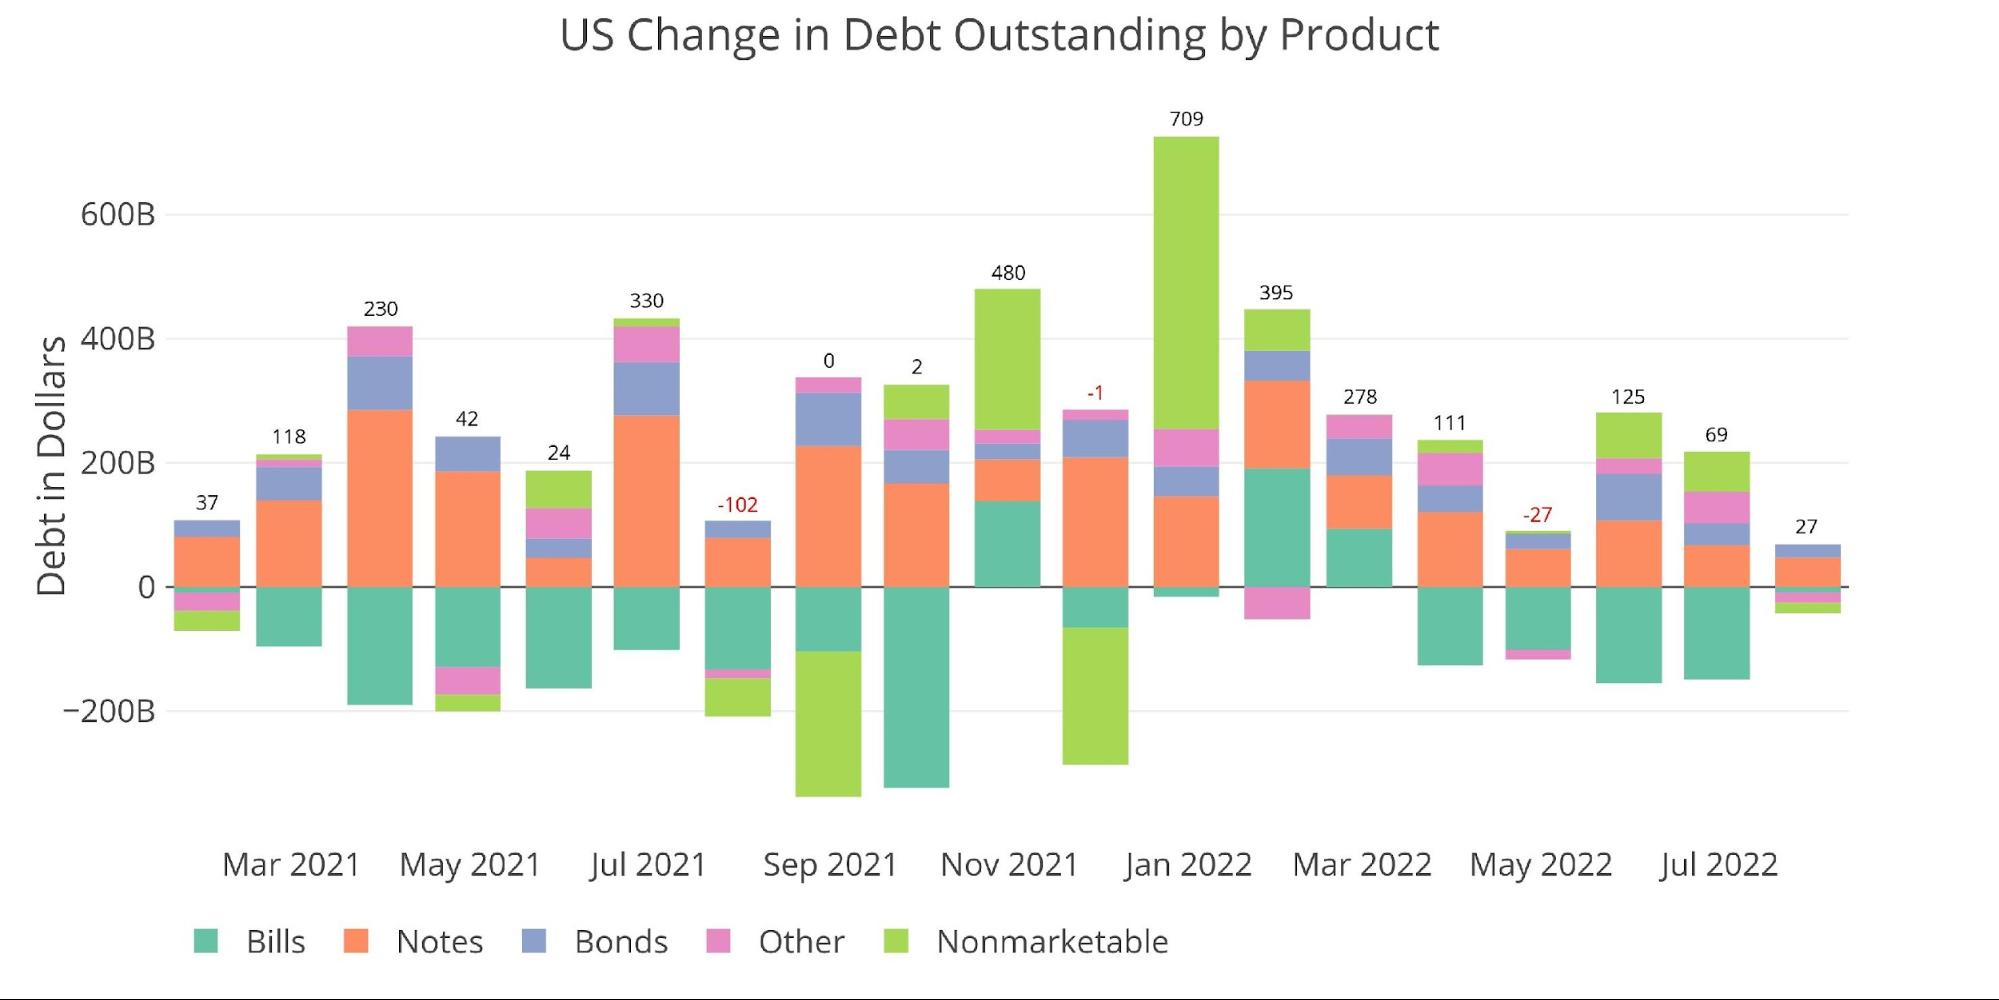
Figure: 1 Month Over Month change in Debt
Despite the recent slow-down in debt issuance, the Treasury has added more than $1T in debt during the first 7 months of the year. The current debt ceiling is $31.4T which leaves the Treasury about $800B before it must pursue “extraordinary measures”.

Figure: 2 Year Over Year change in Debt
The recent conversion of short-term debt to long-term debt can be seen below as the Treasury has extended the average maturity of the debt to record highs. Current average maturity is 6.16 years, up from 5.76 just before Covid hit.
Unfortunately, this has not prevented the interest on the debt from creeping up. The Fed hiking cycle has brought the weighted average interest rate up from 1.3% to 1.53%. 23bps may not sound like much, but on a $30.6T balance, that comes out to $70B!
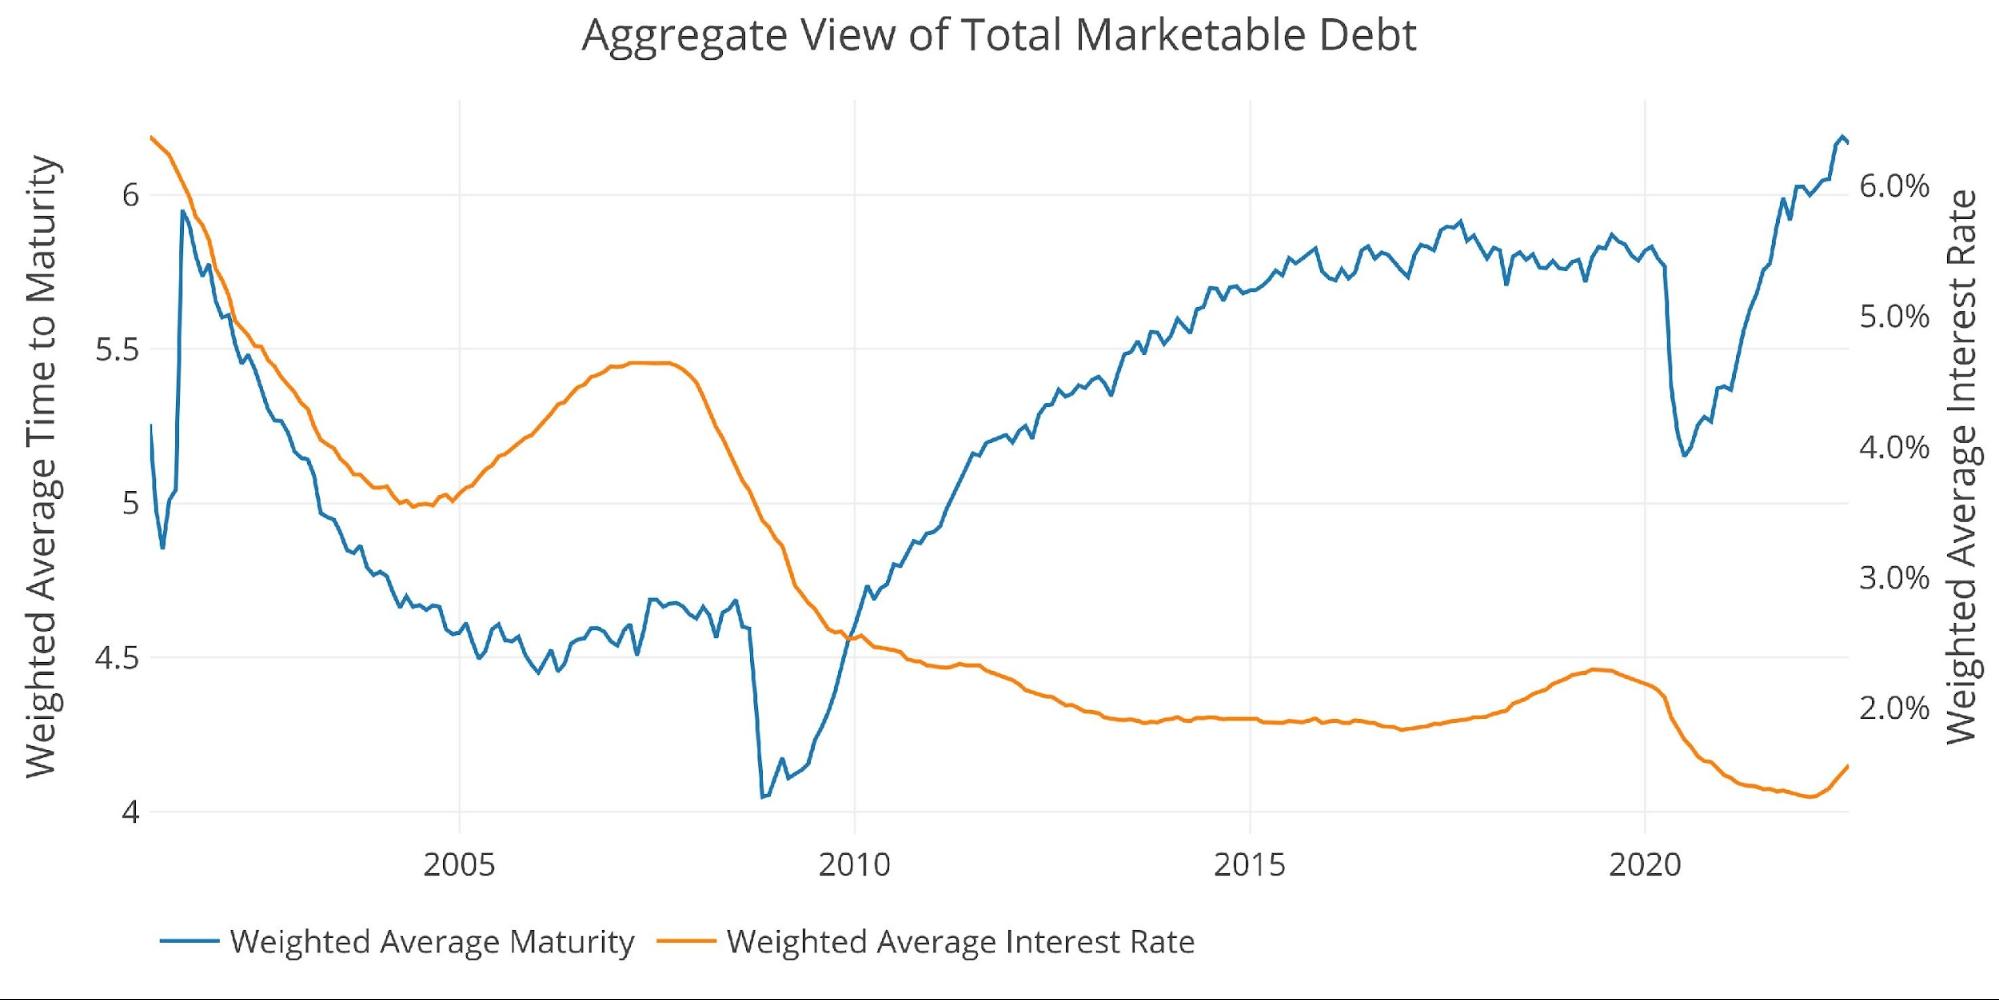
Figure: 3 Weighted Averages
The chart below shows the impact of the higher interest rates. Interest on marketable debt has returned to the old all-time high of $360B in very short order. Even more concerning is the pace of the increase. Interest has increased 22% or $65B in 7 months!
The black line shows the interest as calculated by the Federal budget due out next week (below is through June). This will include other interest charges beyond Marketable debt such as the newly popular I-Bonds, which is doling out interest above 9%!
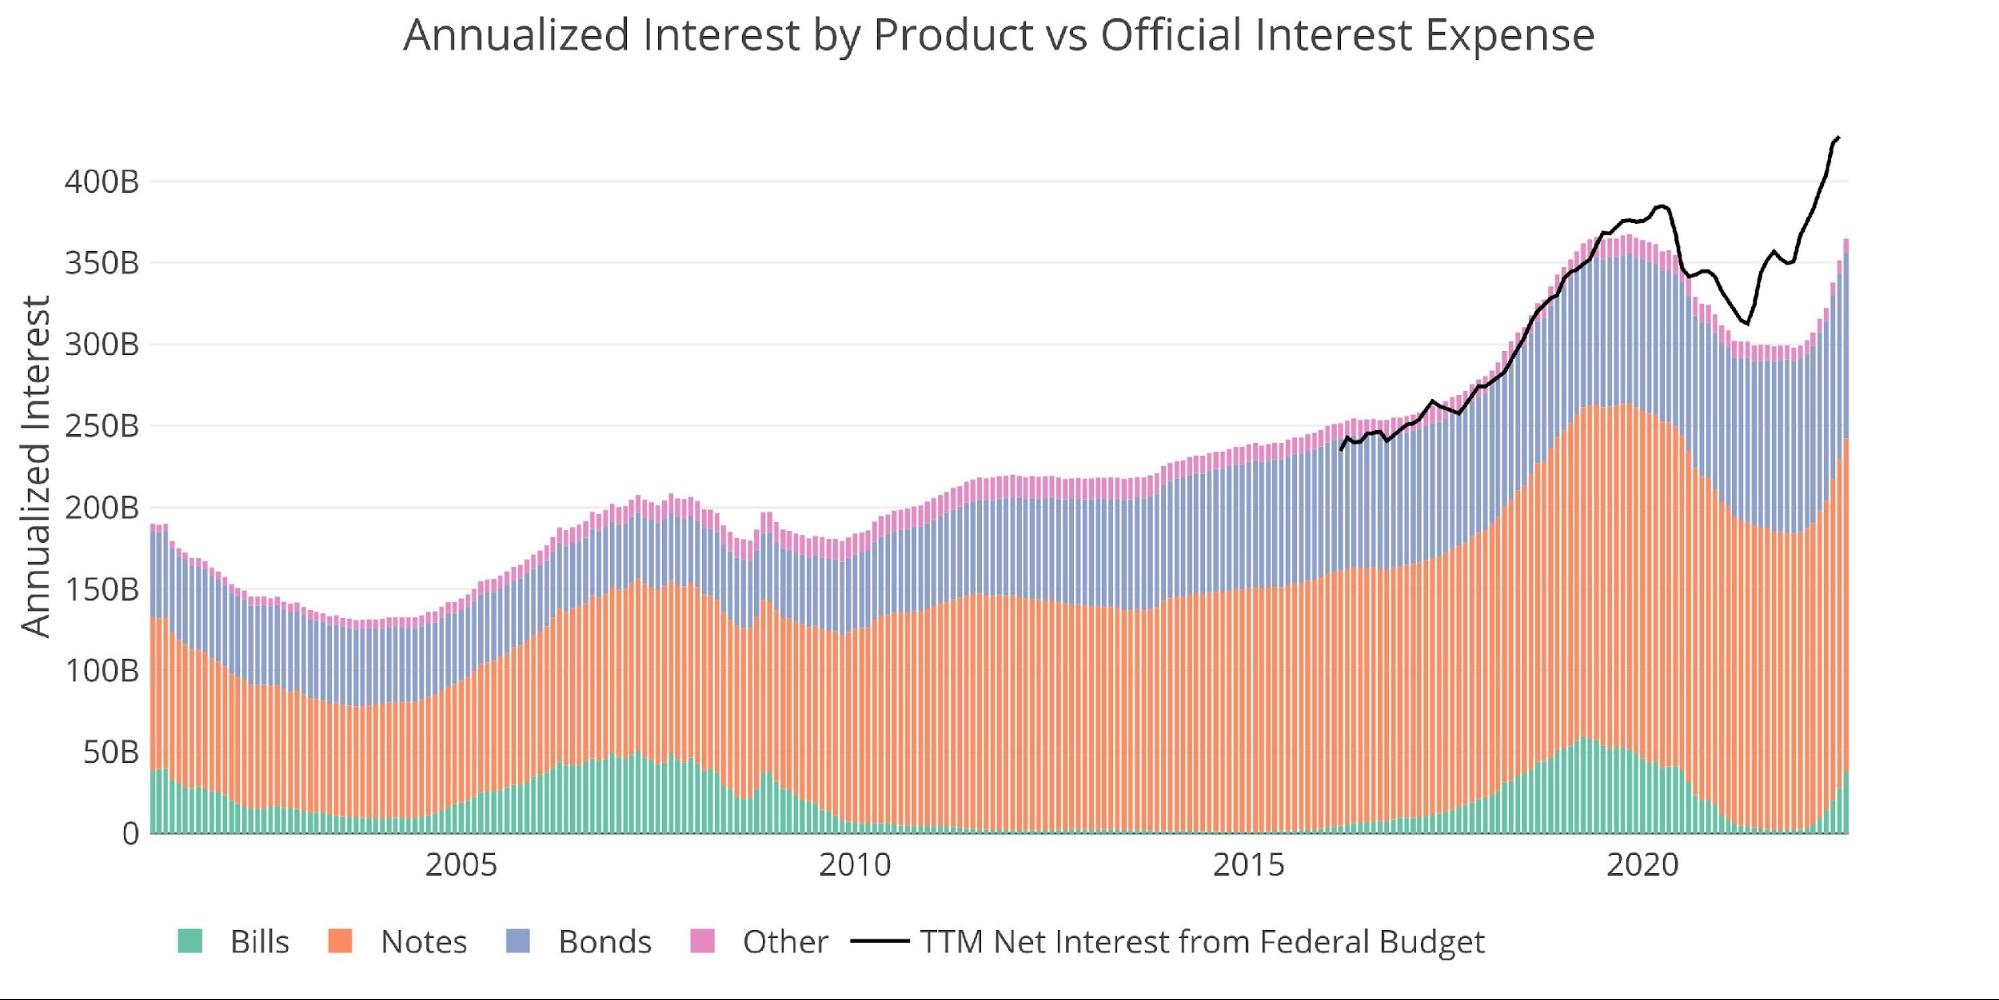
Figure: 4 Net Interest Expense
The chart below shows how the popularity of I-Bonds has exploded since November of last year. The total I-Bonds balance has increased by more than 50% in 8 months. A guaranteed 9% ROI is an incredible investment in these uncertain times. The balance would be way higher if it was not capped at $10k annually per social security number.
Note: I Bonds fall under Non-Marketable debt but is held by the public
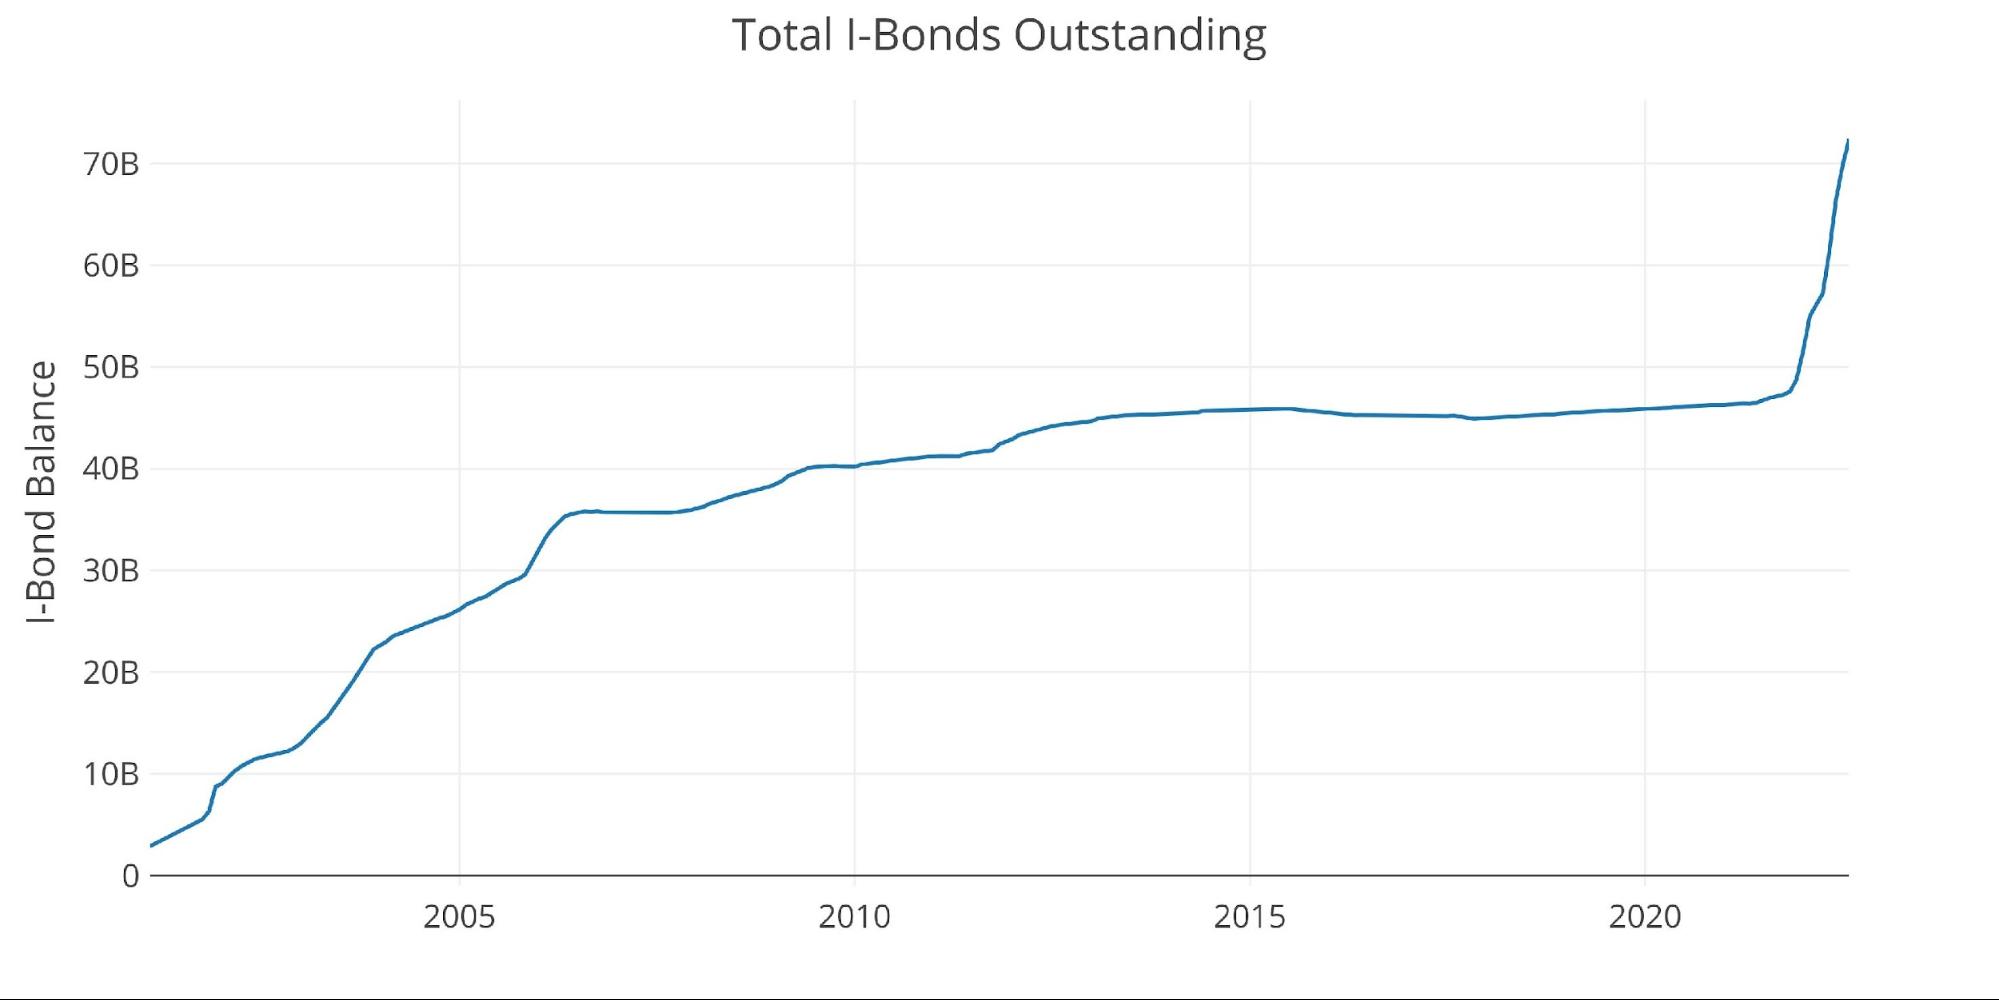
Figure: 5 I Bonds
Digging into the Debt
The table below summarizes the total debt outstanding. A few key takeaways:
On a monthly basis:
-
-
- July issuance was 85% below the TTM average
- New debt was still focused on the long end of the curve with 7-10 year and 20+ seeing the most additions
- Bills saw a modest net reduction of $9B
-
On a TTM Basis:
-
-
- Debt is up $2.1T which is actually greater than the $1.9T added as of July 2021 but well below the $4.5T added as of July 2020
- Even the balance within Notes has been targeted for extension
-
- Issuance of 1-3 year and 3-7 year is down 55% and 46.5% respectively, whereas issuance of 7-10 year has increased 251%!
-
-
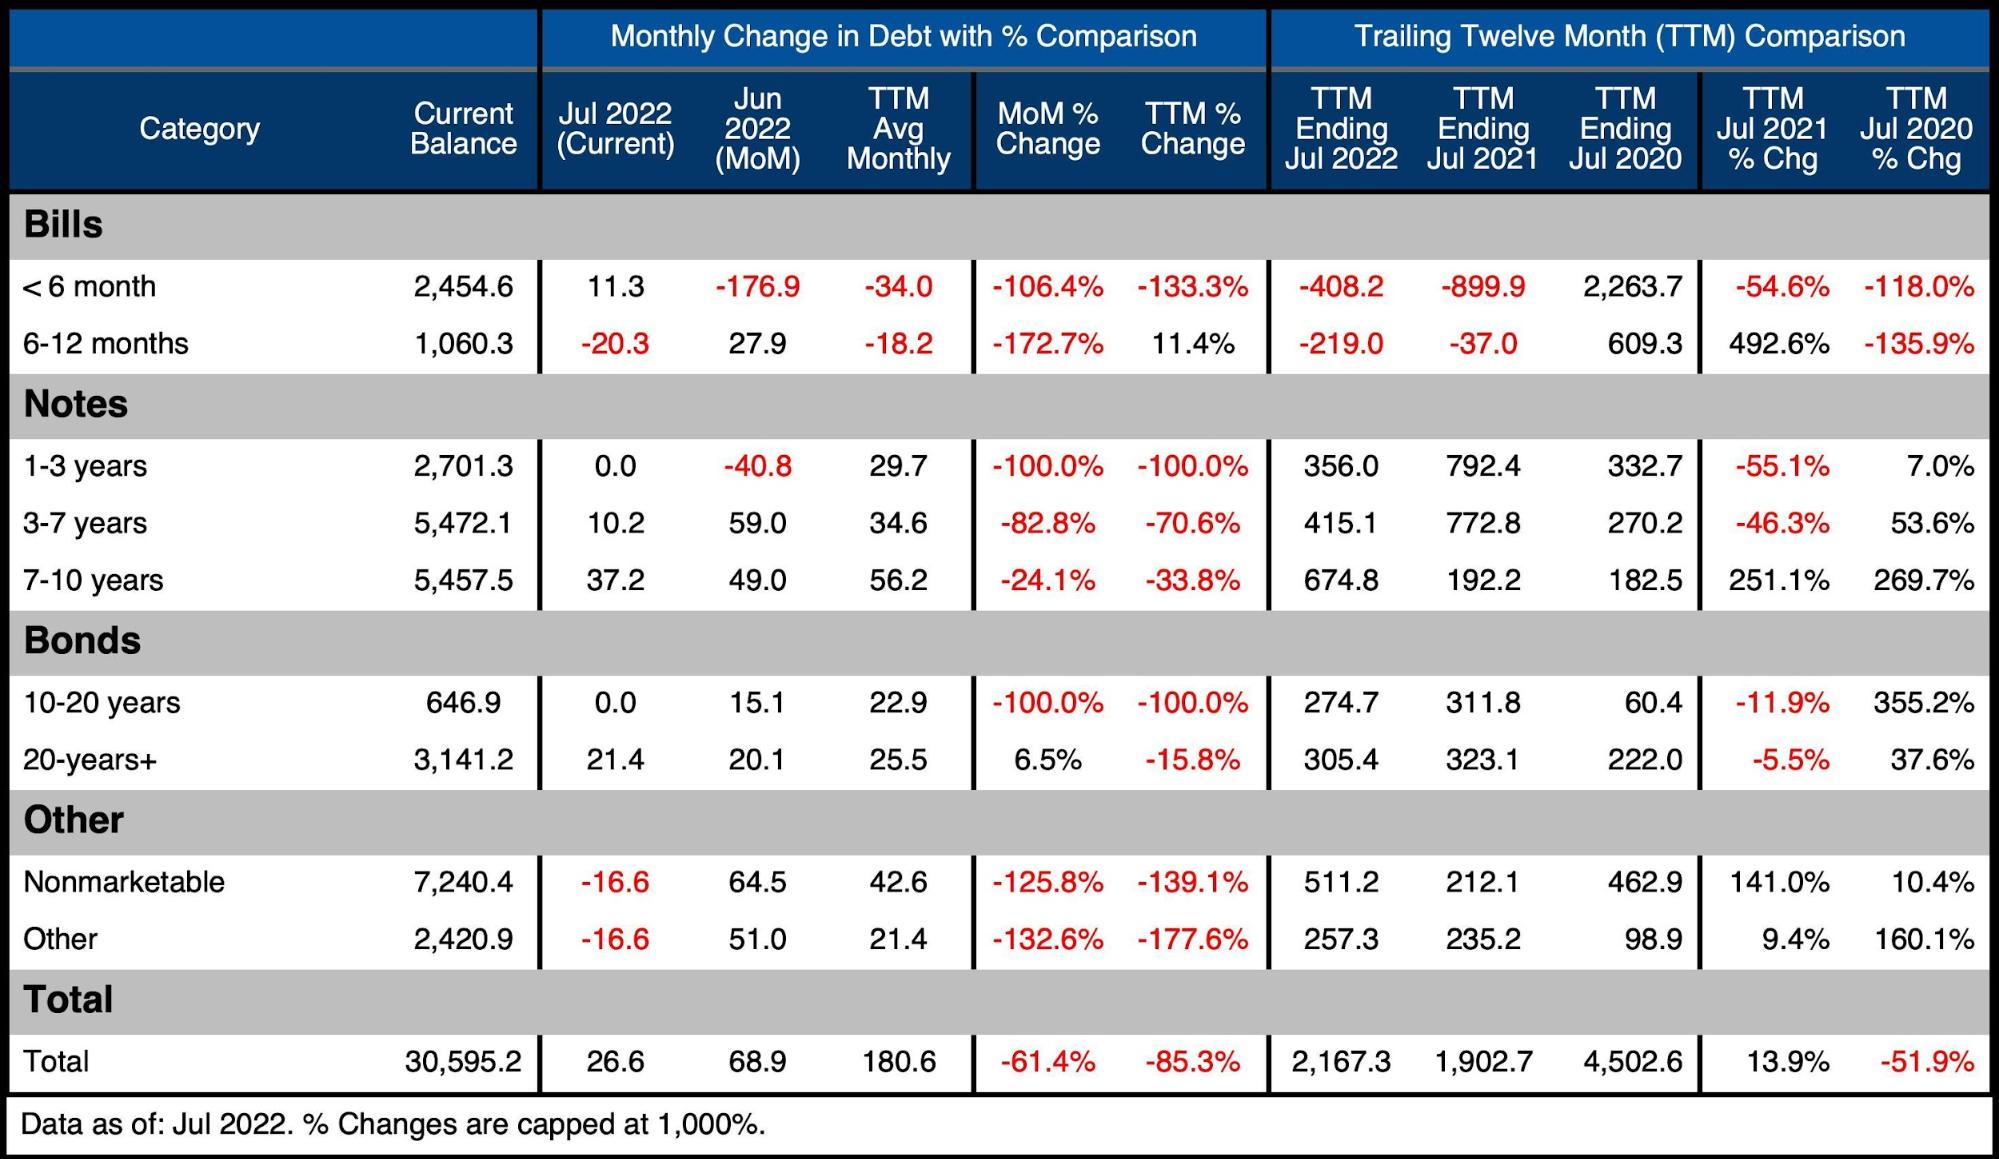
Figure: 6 Recent Debt Breakdown
Debt Rollover
As shown above, annualized interest on the debt has surged in recent months. This will only continue as the Treasury is forced to roll over significant amounts of debt in the months ahead at much higher rates as shown below.
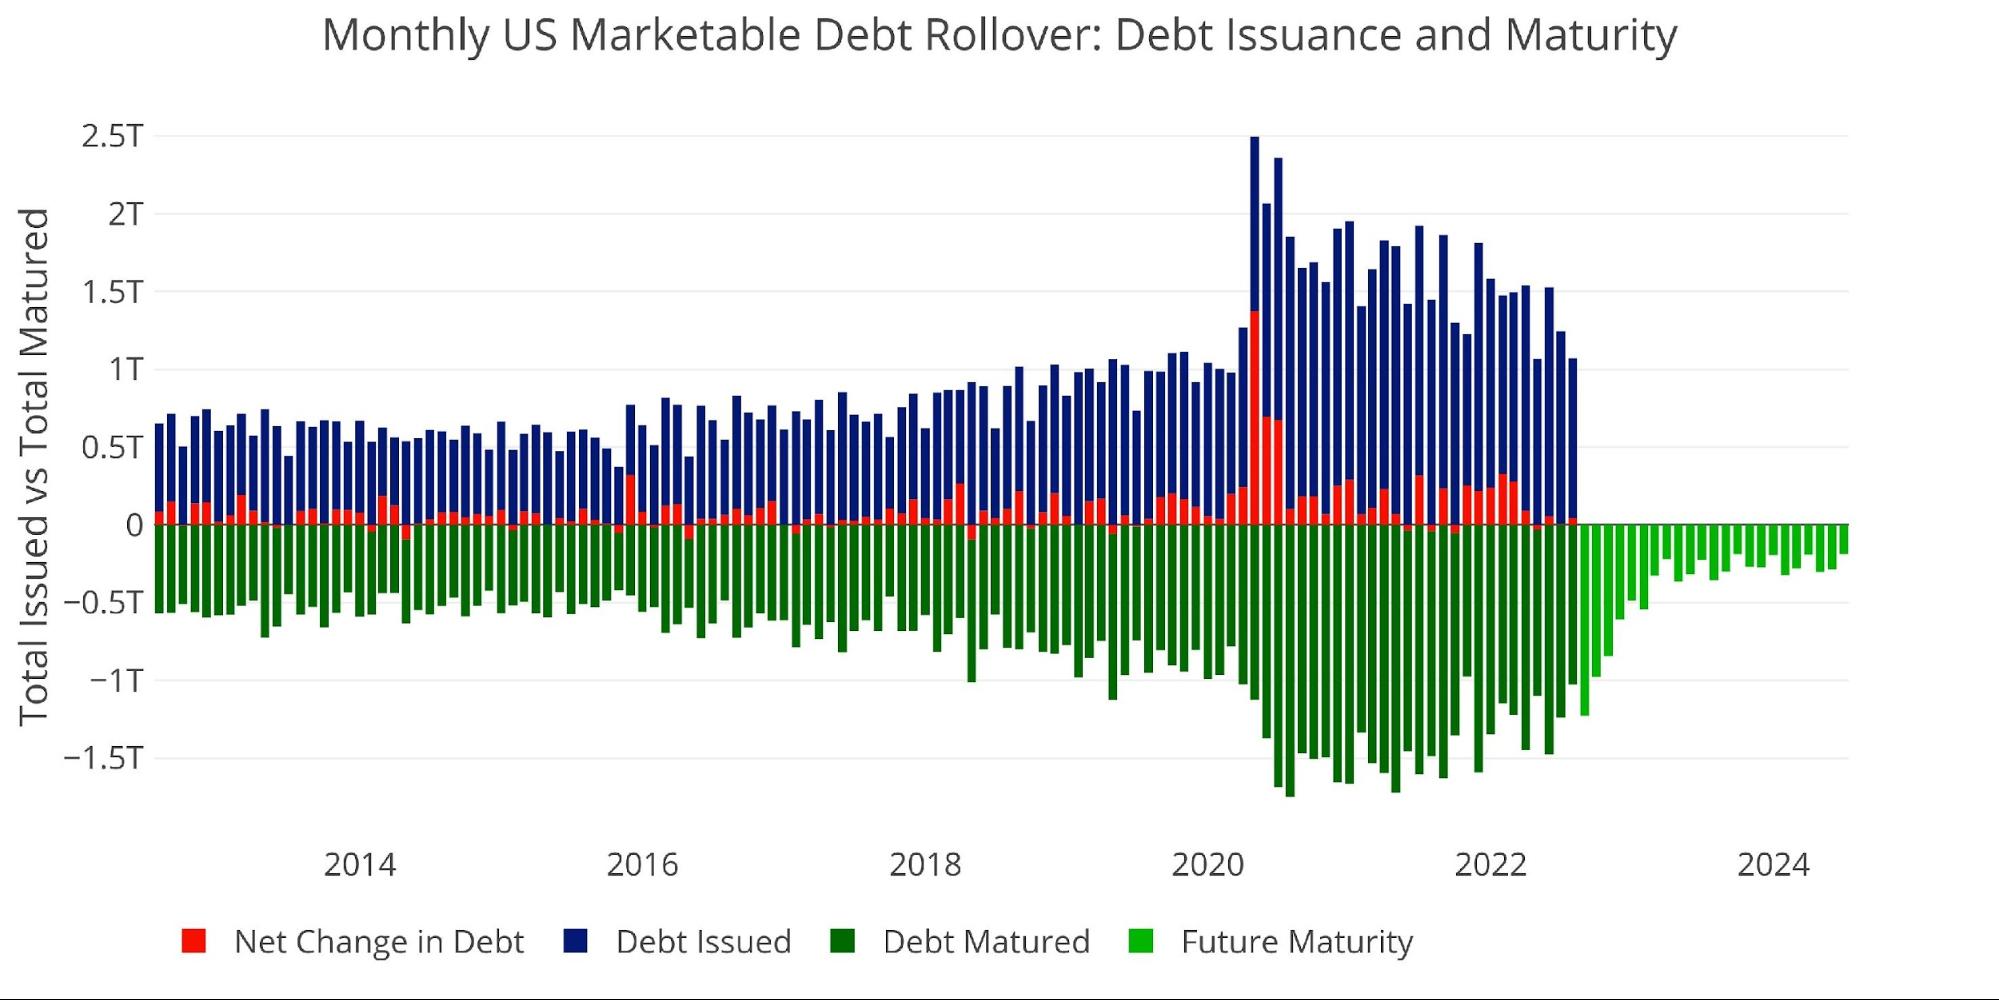
Figure: 7 Monthly Rollover
Note “Net Change in Debt” is the difference between Debt Issued and Debt Matured. This means when positive it is part of Debt Issued and when negative it represents Debt Matured
T-Bills (< 1 year)
The majority of monthly rollover occurs in Treasury Bills. The latest Fed hike of 75 Bps has not even begun to ripple through Bills. The June hike has only worked its way through about 25% of outstanding Bills. This means that 150 Bps still has to work its way through most of the $3.5T Bills balance. Based on the schedule below, interest on Bills alone will increase $45B by December, not including further rate hikes.
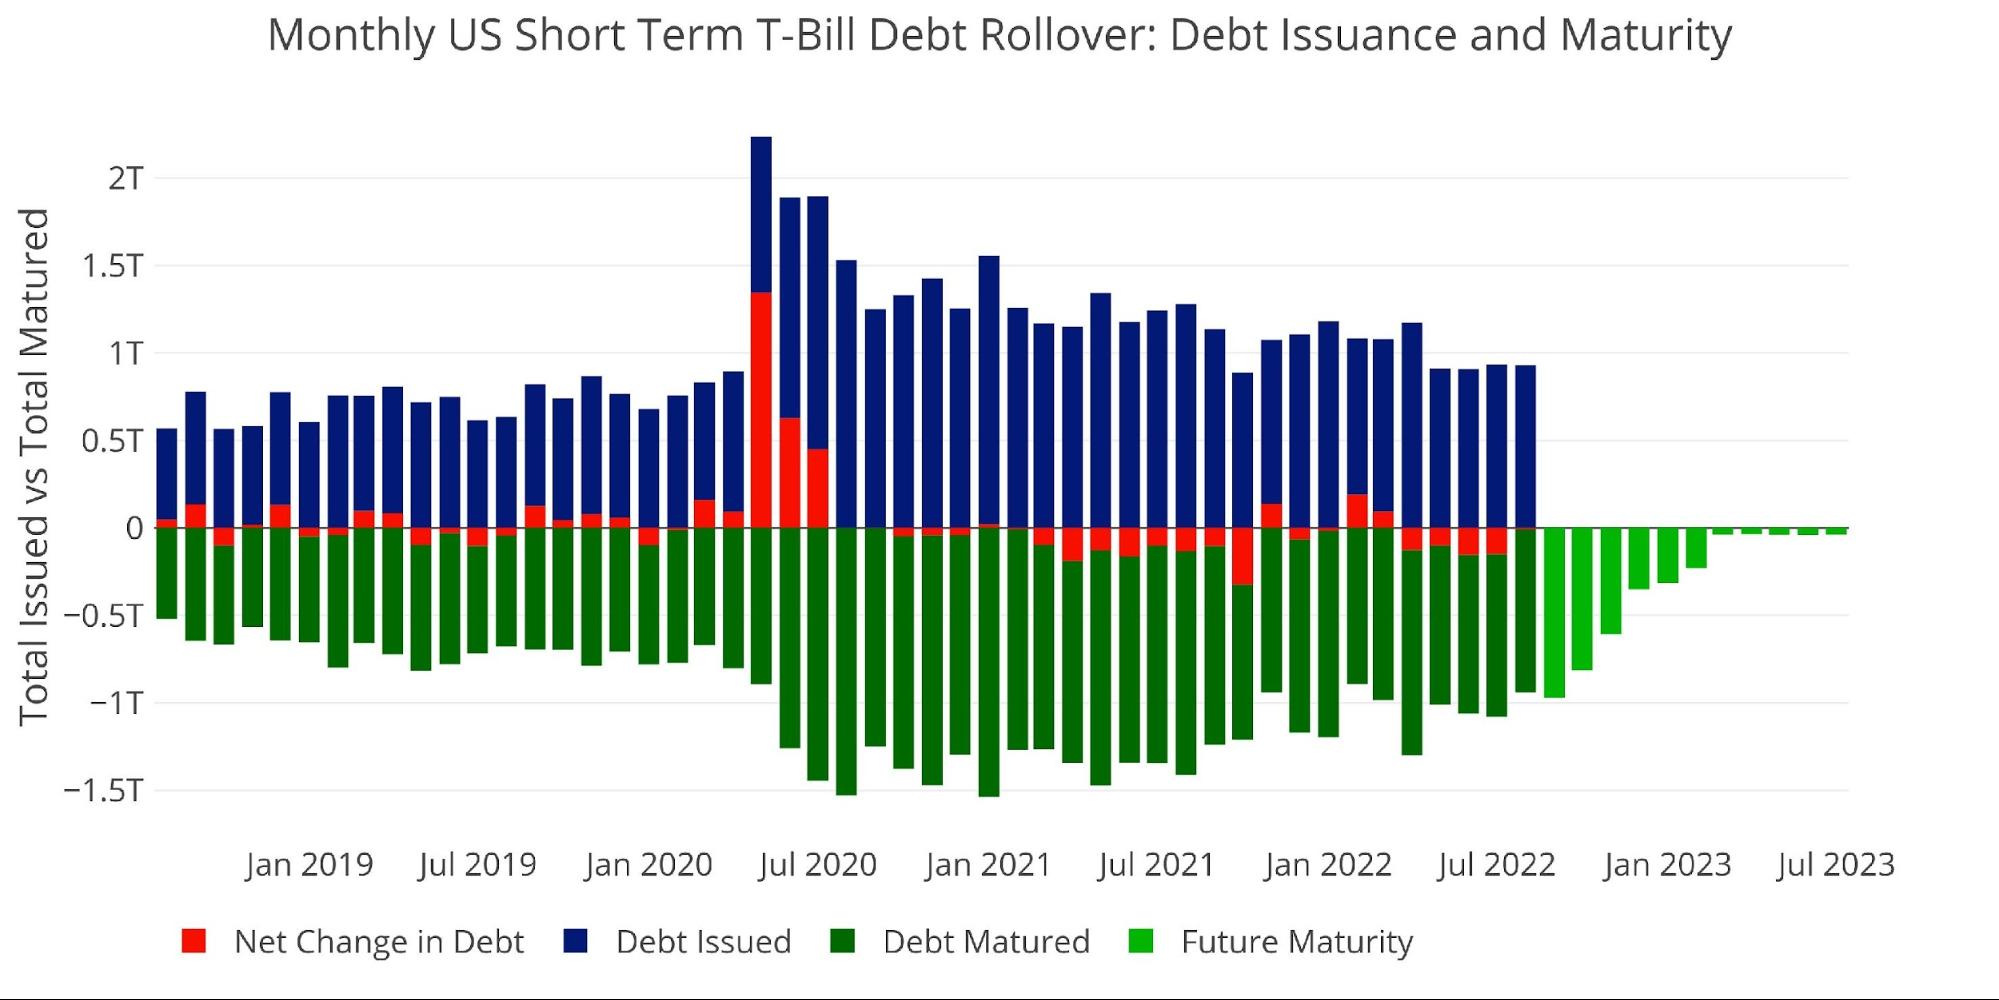
Figure: 8 Short-Term Rollover
Treasury Notes (1-10 years)
Despite the lengthened maturity, the Treasury is not that well protected from a rapid increase in short-term rates. Bills present the biggest risk, but Notes are relatively short-term with an average maturity of 3.44 years and account for 44.6% of the $30T balance. The rollover schedule can be seen below. $4T is set to roll over by December 2023!
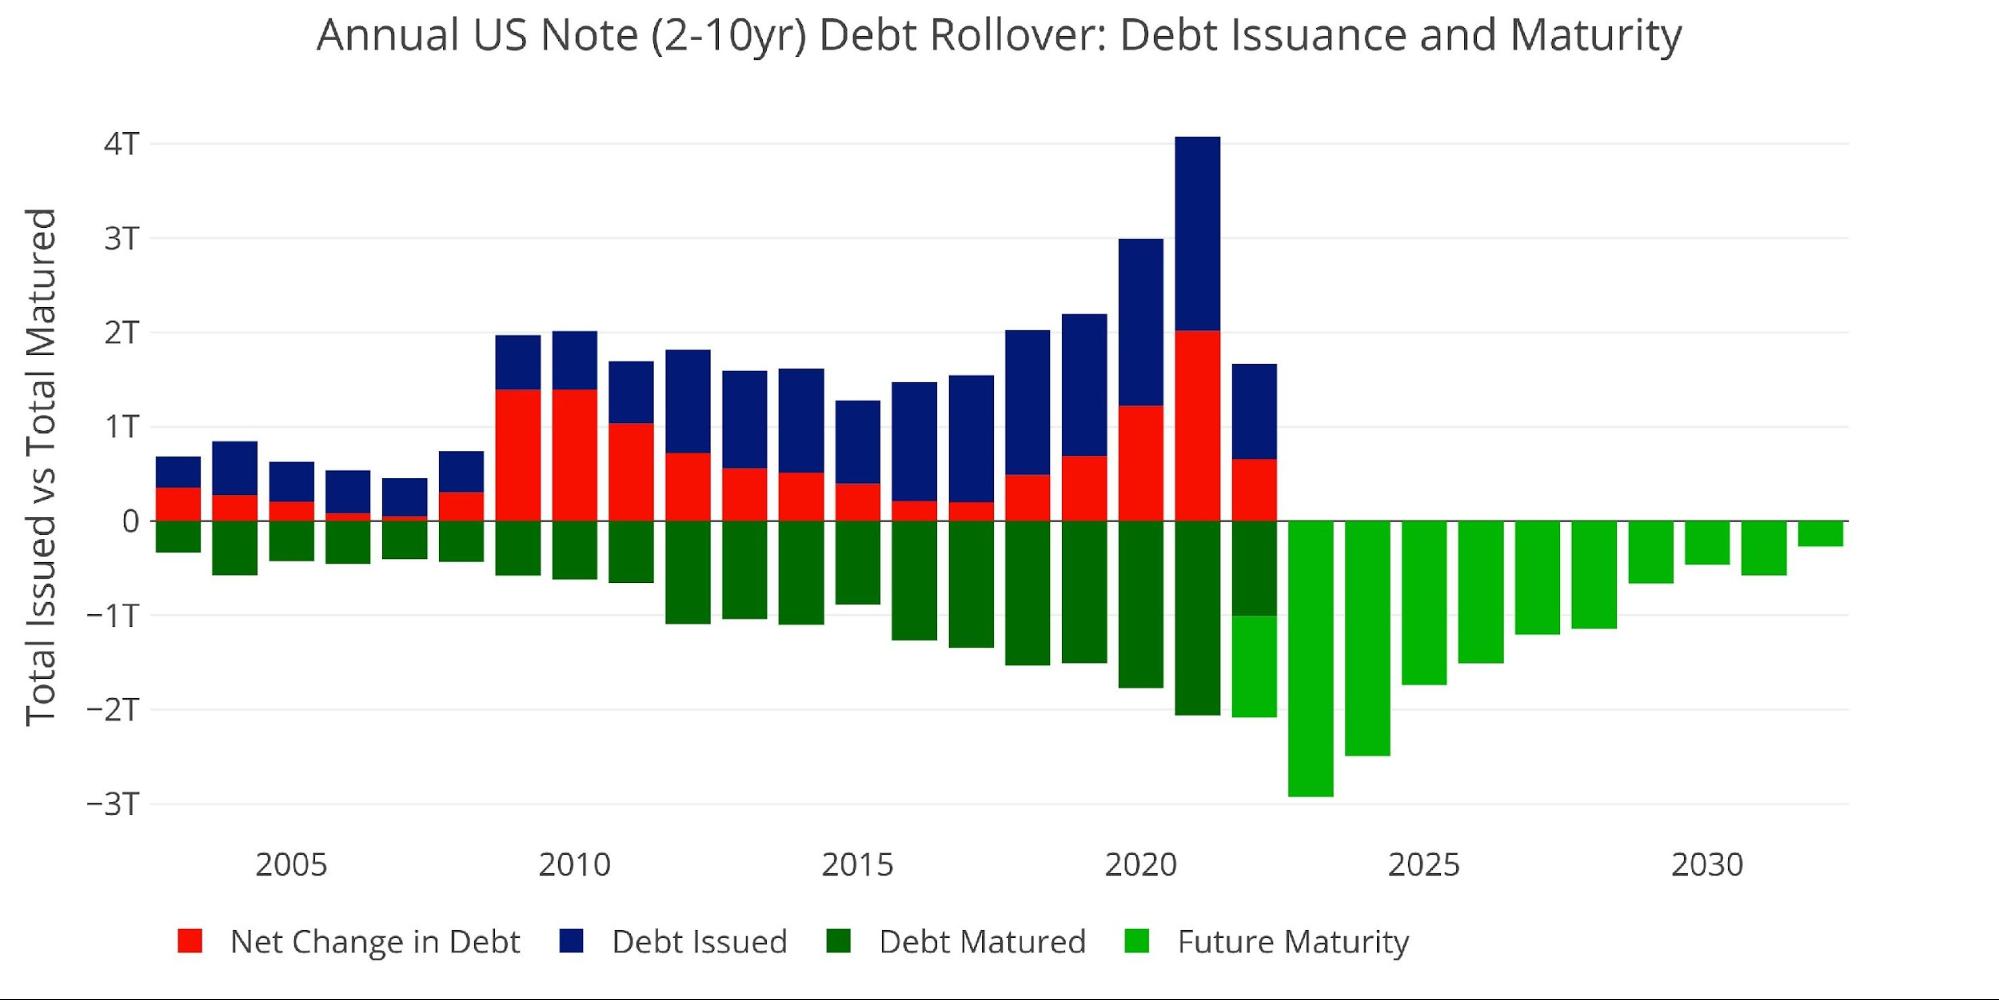
Figure: 9 Treasury Note Rollover
The Yield Curve
One benefit for the Treasury at the moment is the inversion of the yield curve. The cost of issuing longer-dated debt is actually cheaper than issuing shorter-term debt. While an inverted yield curve is generally a sign of impending recession, it does create a windfall for the Treasury. They get to lengthen the maturity of their debt and save money! The yield curve is the most inverted since the early 2000s. This would help explain some of the recent activity with the Fed taking advantage by buying Notes on the long end.
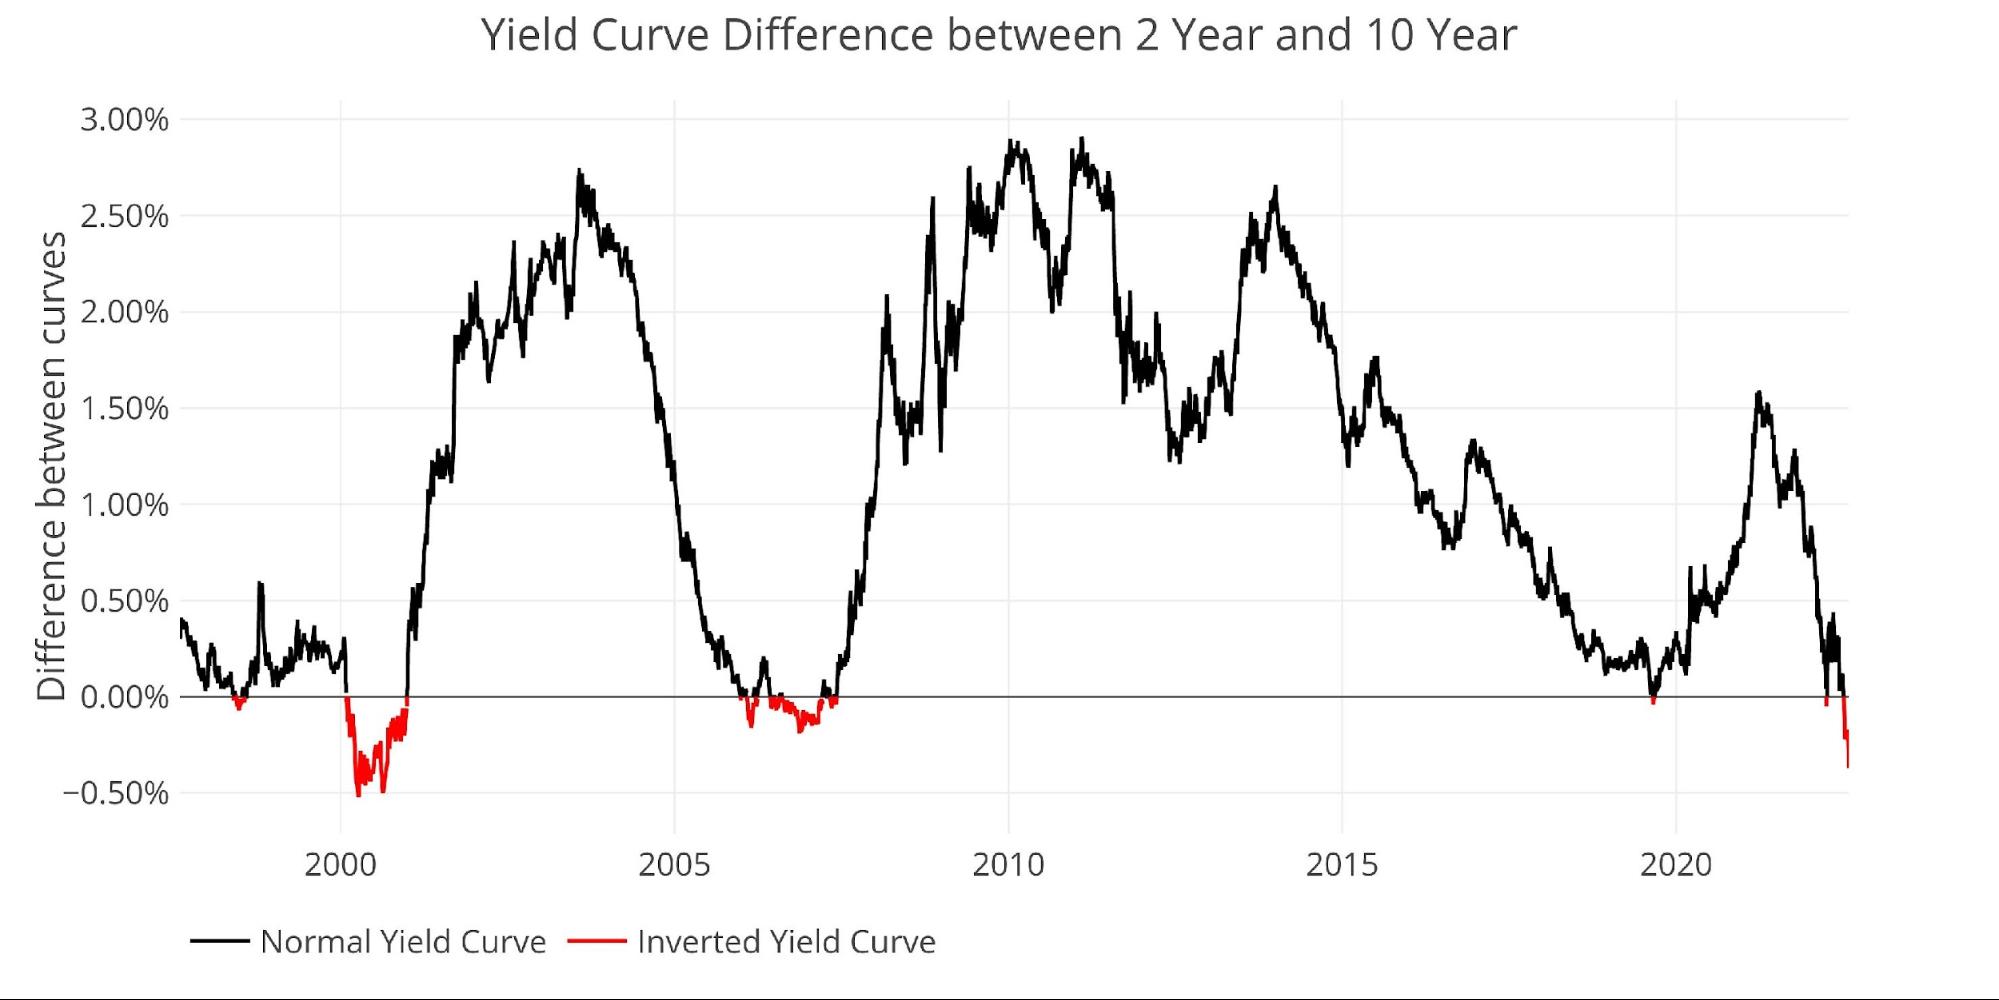
Figure: 10 Tracking Yield Curve Inversion
Historical Perspective
While total debt has now exceeded $30T, not all of it poses a risk to the Treasury. There is $7T+ of Non-Marketable securities which are debt instruments that cannot be resold. The vast majority of Non-Marketable is money the government owes to itself (not including I-Bonds). For example, Social Security holds over $2.8T in US Non-Marketable debt. This debt poses zero risk because any interest paid is the government paying itself. The risk will be when Social Security needs to start selling that debt.
The remaining $23T is broken down into Bills (<1 year), Notes (1-10 years), Bonds (10+ years), and Other (e.g., TIPS). The Fed owns $5.7T, which also poses zero risk because the Fed remits all interest payments back to the Treasury. The Fed has promised to begin selling that debt, but QT is getting off to a very slow start.
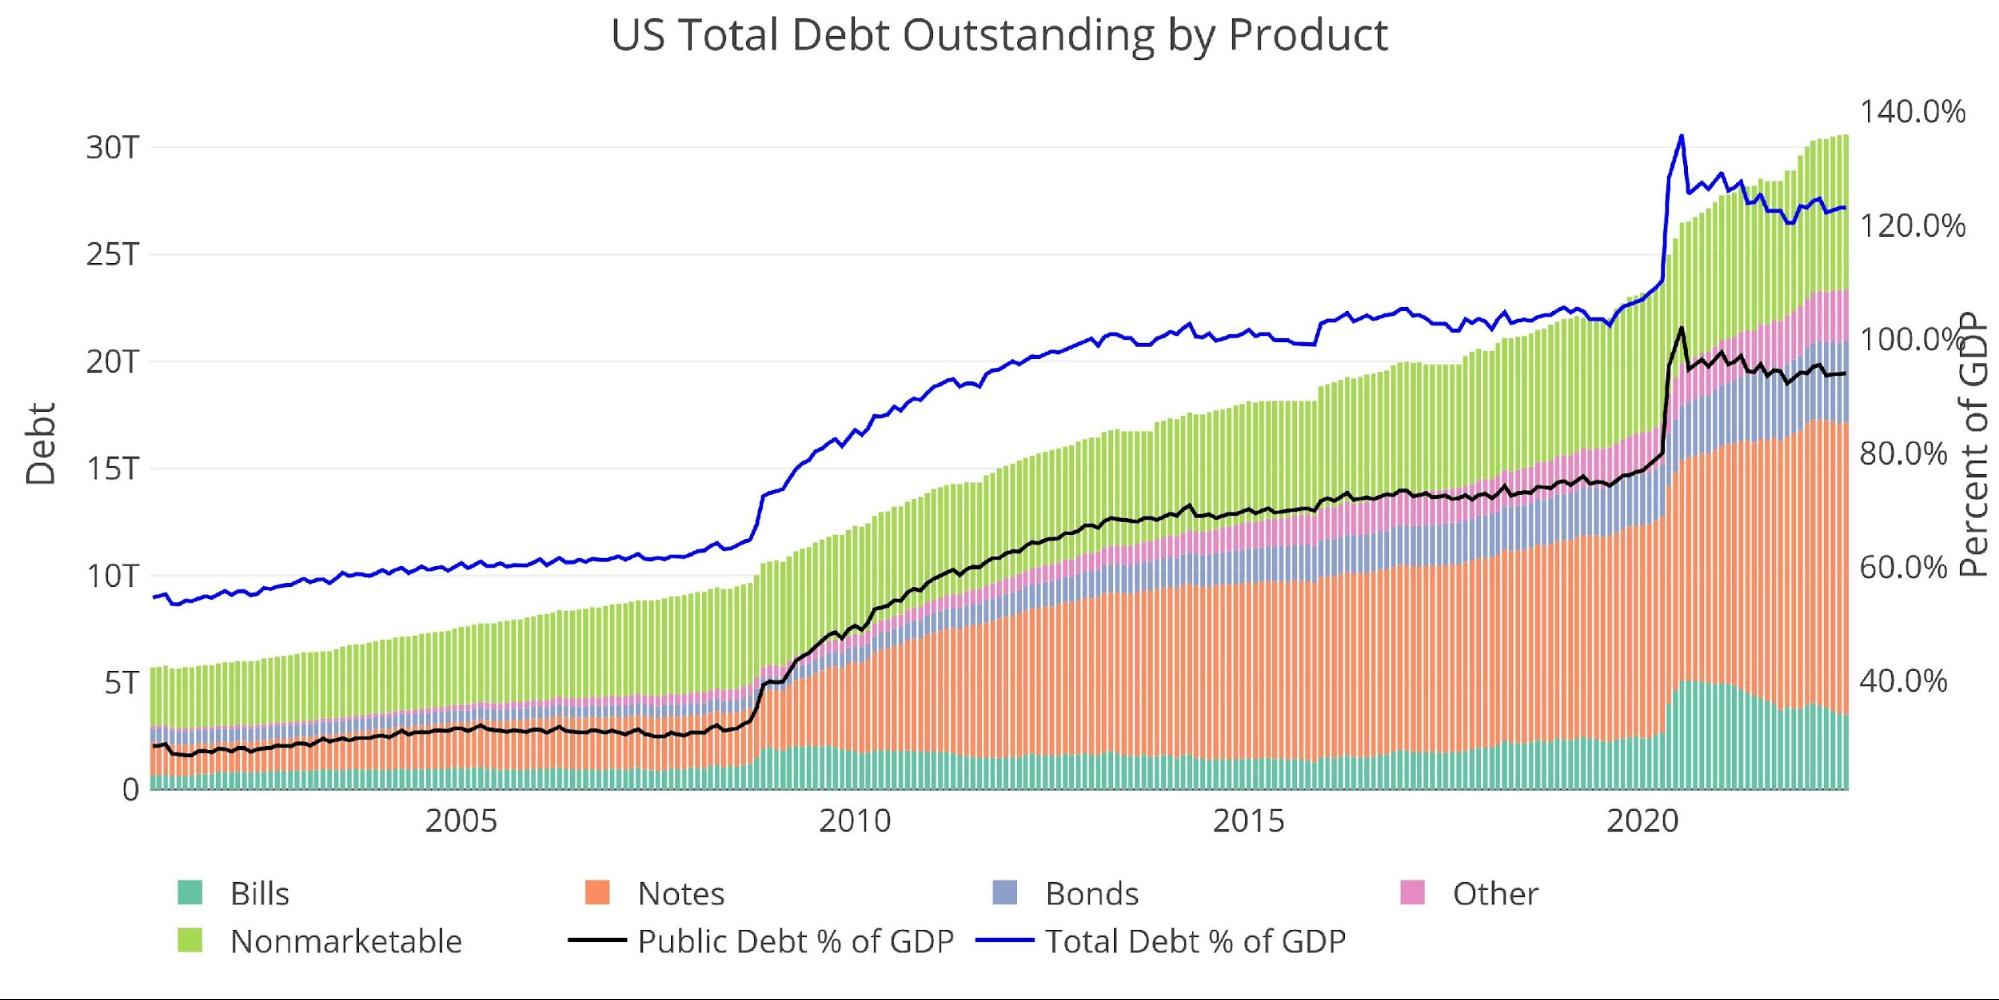
Figure: 11 Total Debt Outstanding
The chart below shows how the reprieve offered by Non-Marketable securities has been fully used up. Pre-financial crisis, non-marketable debt was more than 50% of the total. That number has fallen to 23.7%. In recent months, the Treasury has increased issuance of Non-Marketable but it’s not enough to make up the ground it has lost.
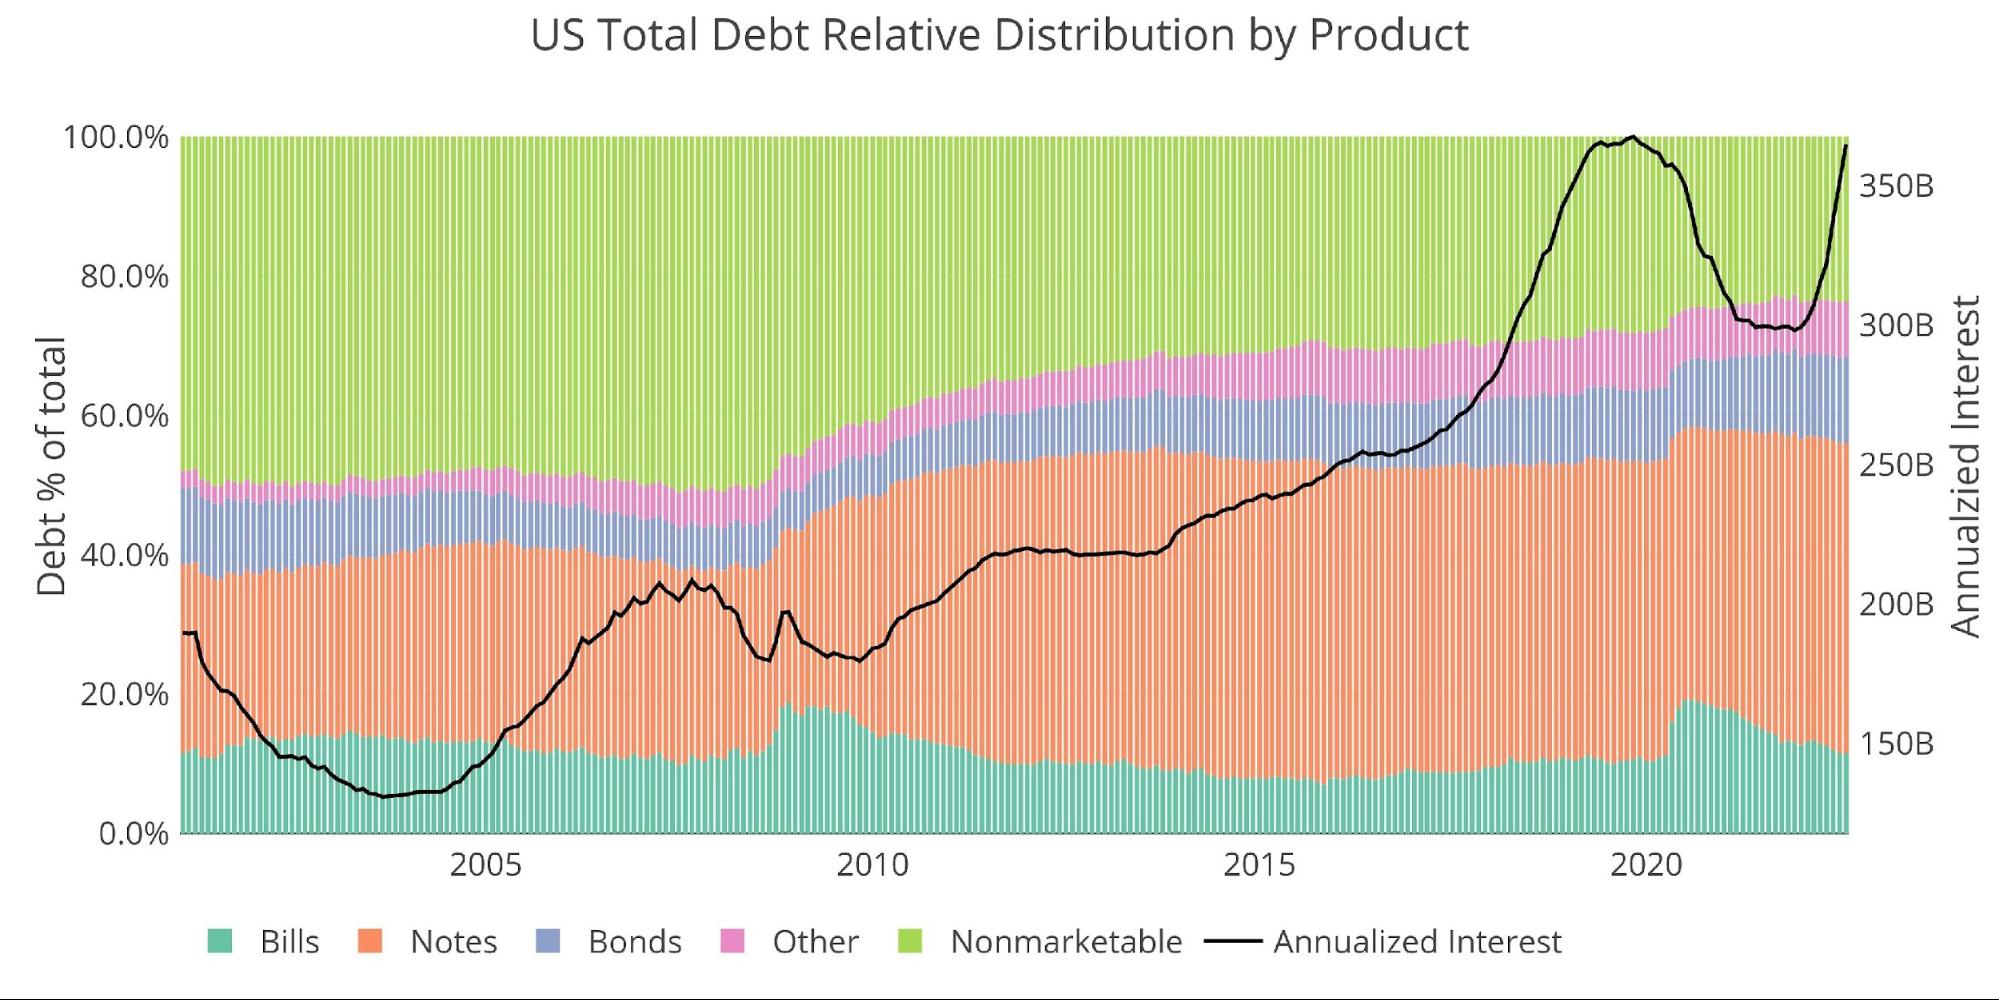
Figure: 12 Total Debt Outstanding
Historical Debt Issuance Analysis
As shown above, recent years have seen a lot of changes to the structure of the debt. Even though the Treasury has extended the maturity of the debt, it no longer benefits from the free debt in Non-Marketable securities. Furthermore, the debt is so large that even though short-term debt has shrunk as a % of total, it is still a massive aggregate number ($3.5T).
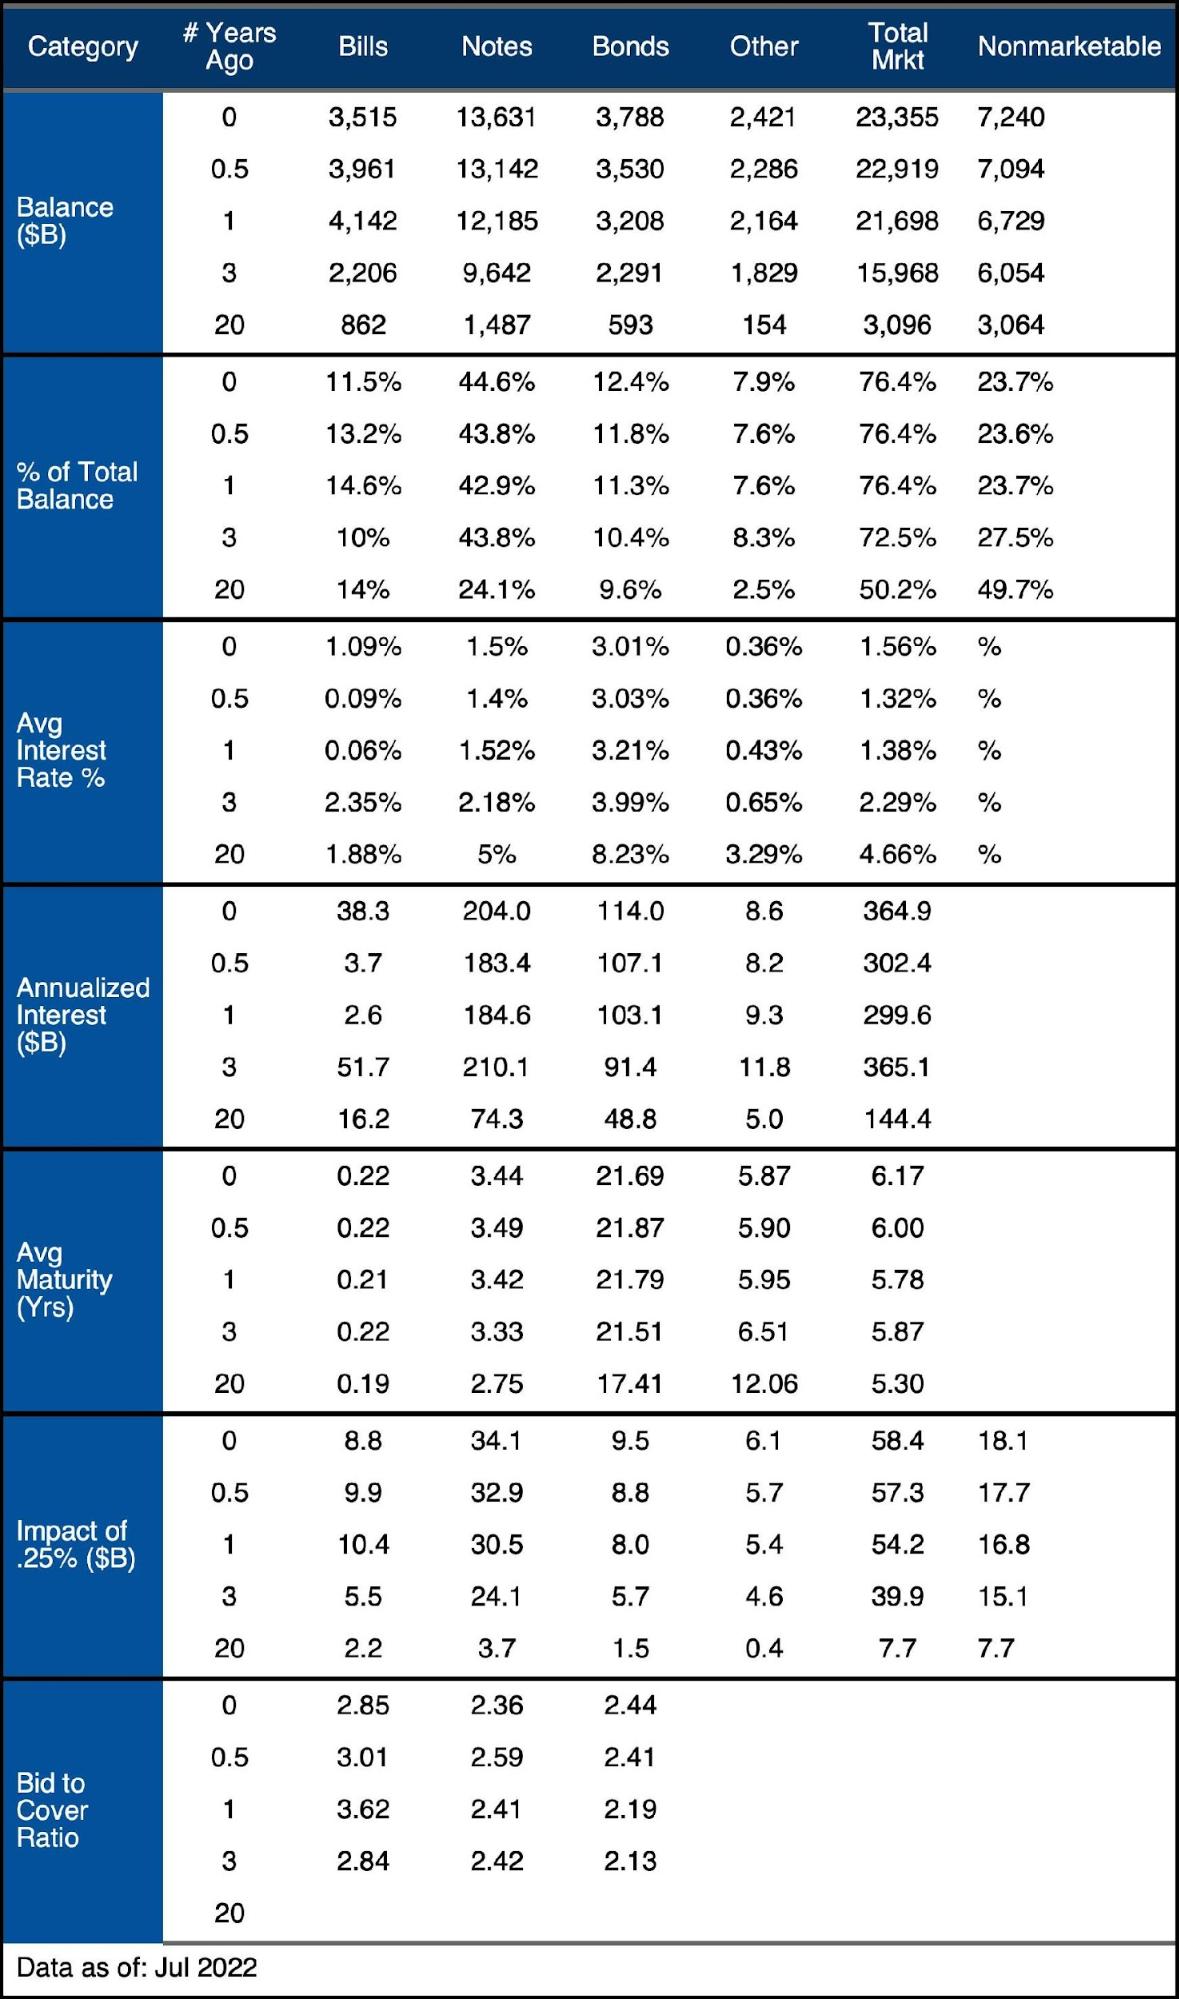
Figure: 13 Debt Details over 20 years
It can take time to digest all the data above. Below are some main takeaways:
-
-
- Annualized interest has increased from $302B to $365B in 6 months
-
- Over the same period, average maturity has increased from 6 to 6.17 years
-
- Over 20 years, Non-Marketable debt has increased from $3T to $7.2T but has fallen as a percentage from 50% to 24%
-
- The debt is growing too fast for Non-Marketable to keep up
-
- Each “over-sized” rate hike of 0.75% increases annualized debt on the following instruments by the amount shown below. Keep in mind, it takes time to work its way through the longer-dated maturities like Notes and Bonds.
-
- Bills: $26.4B
- Notes: $102.3B
- Bonds: $28.5B
-
- Annualized interest has increased from $302B to $365B in 6 months
-
What it means for Gold and Silver
While the market continues to see the current Fed as being “tough on inflation”, Powell is a far cry from Volker, with real interest rates still very negative. Even though negative real rates will do little to combat raging inflation, they will do plenty to upend anyone sitting with a lot of short-term or adjustable-rate debt. Look no further than the US Treasury for the biggest party at risk.
A strong July jobs report has given the Fed more room to deny recession and take another aggressive rate hike in September. The Fed is moving very quickly and the math is just starting to catch up. The Treasury could quickly find itself paying more than $500B in annual interest payments. What then? What if inflation is still high? Can the Fed keep hiking and send the US government into a debt spiral while also destroying the value of their own balance sheet?
This seems unlikely at best. The Fed has to pivot because it mathematically has to! This is the same reason interest rates are not above the rate of inflation today. They can’t be! The US Treasury, along with every other over-stretched borrower, would go belly up. The Fed won’t let this happen.
Data Source: https://www.treasurydirect.gov/govt/reports/pd/mspd/mspd.htm
Data Updated: Monthly on fourth business day
Last Updated: Jul 2022
US Debt interactive charts and graphs can always be found on the Exploring Finance dashboard: https://exploringfinance.shinyapps.io/USDebt/

Call 1-888-GOLD-160 and speak with a Precious Metals Specialist today!
Buka akaun dagangan patuh syariah anda di Weltrade.
Source link