After a big miss on the Powell/Brainard nominations in November, the price analysis has been fairly accurate. Identifying the initial breakout above $1800, mentioning that $1900 was fragile support, and last month concluding that gold had found a bottom around $1800.
For the past month, gold has been consolidating within a tight range around $1850. The data suggests the next move is most likely up. Lots of indicators have bottomed, which leaves little downside remaining. The market has also priced in an extremely aggressive Fed and held up very well over that time.
It’s very possible that jobs data in two weeks will be weak. This could give the Fed the cover needed to start rolling over, proving that the Fed may be close to done on its inflation fight. Silver looks less promising in the immediate future, but should follow gold over the medium and long-term.
Resistance and Support
Gold
Gold has carved out a very nice bottom in the last month above $1800 and staying closer to its current resistance of $1850. It’s been making more attempts at $1850 than $1800. The conclusion last month was “Neutral” waiting for a break above $1850 or below $1800. While a break above $1850 might not be immediate, it seems far less likely that $1800 will break to the downside.
Outlook: Bullish
Silver
Silver is also stuck in a range between $21 and $22. The price action is not as bullish as it has made volatile attempts on both sides. It currently sits at the lower end of the range with no clear signal on which direction is next.
Outlook: Neutral
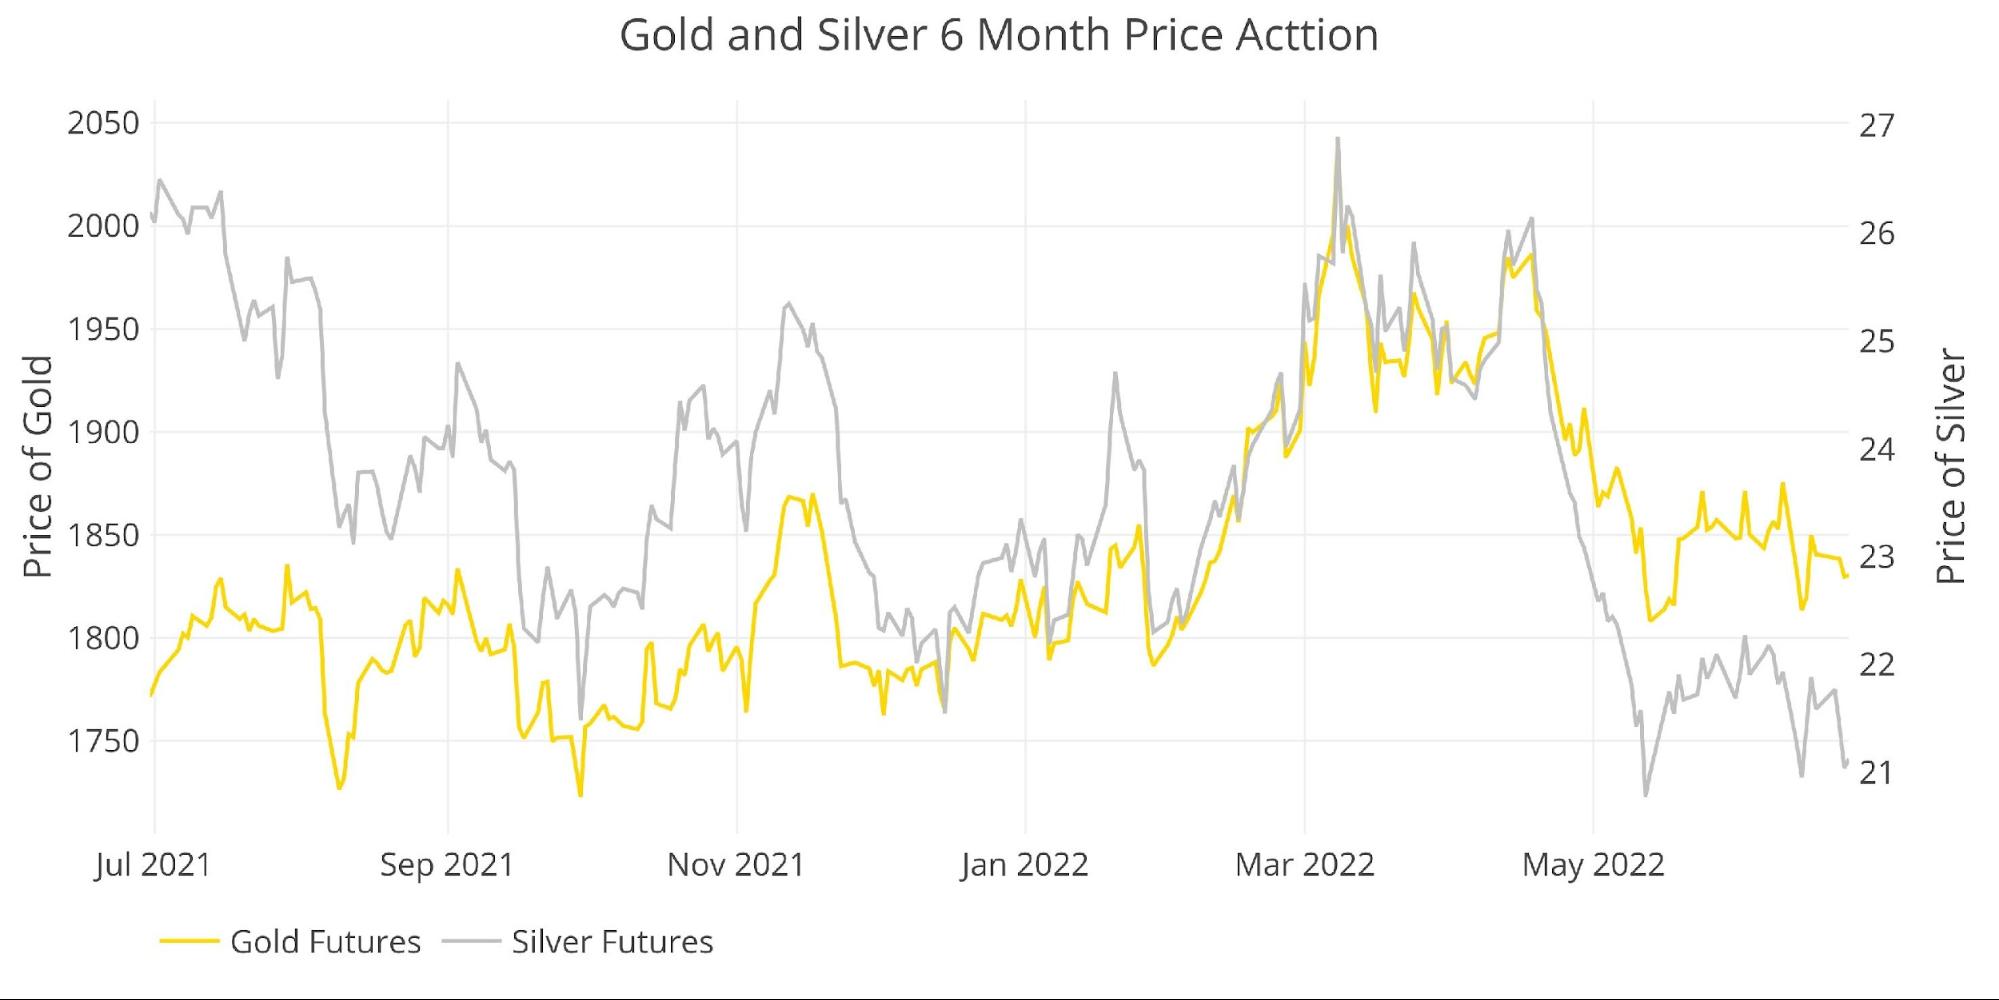
Figure: 1 Gold and Silver Price Action
Daily Moving Averages (DMA)
Gold
The 50 DMA ($1868) still sits above the 200DMA ($1844) but is moving down with the price below both. This is very typical and healthy in bull markets. A previous analysis highlighted how rare it is to see a dramatic and consistent pull-away from the 50 from the 200. The retest helps build stronger support in bull runs. While the current price sits below both averages, the pull-back looks to be in a bottoming phase.
Outlook: Bullish
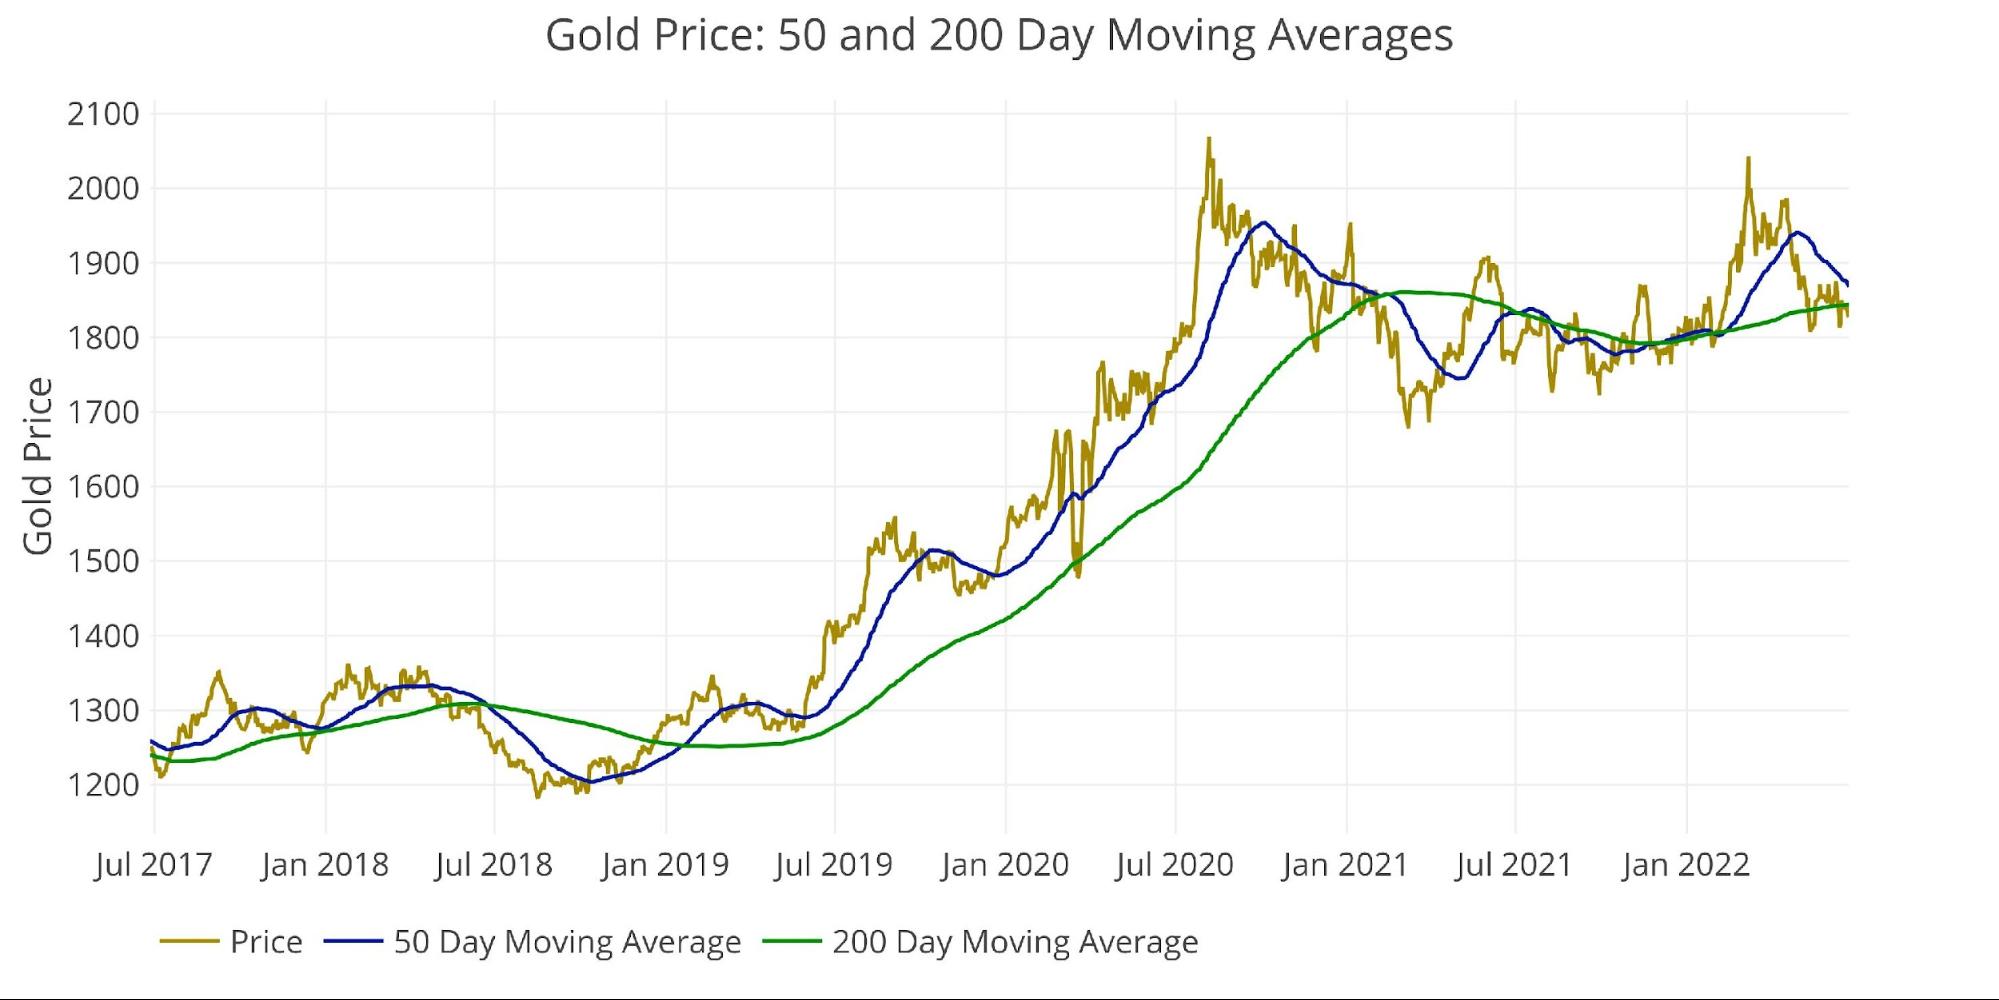
Figure: 2 Gold 50/200 DMA
Silver
The silver 50 DMA ($22.44) has crashed back below the 200DMA ($23.39) forming a death cross. This is a bearish indicator. While silver typically follows gold, the death cross should not be ignored. It’s possible that in a recessionary environment, silver could get sold harder as an industrial metal versus buying on monetary security. Gold is less prone to such an outcome.
Outlook: Bearish
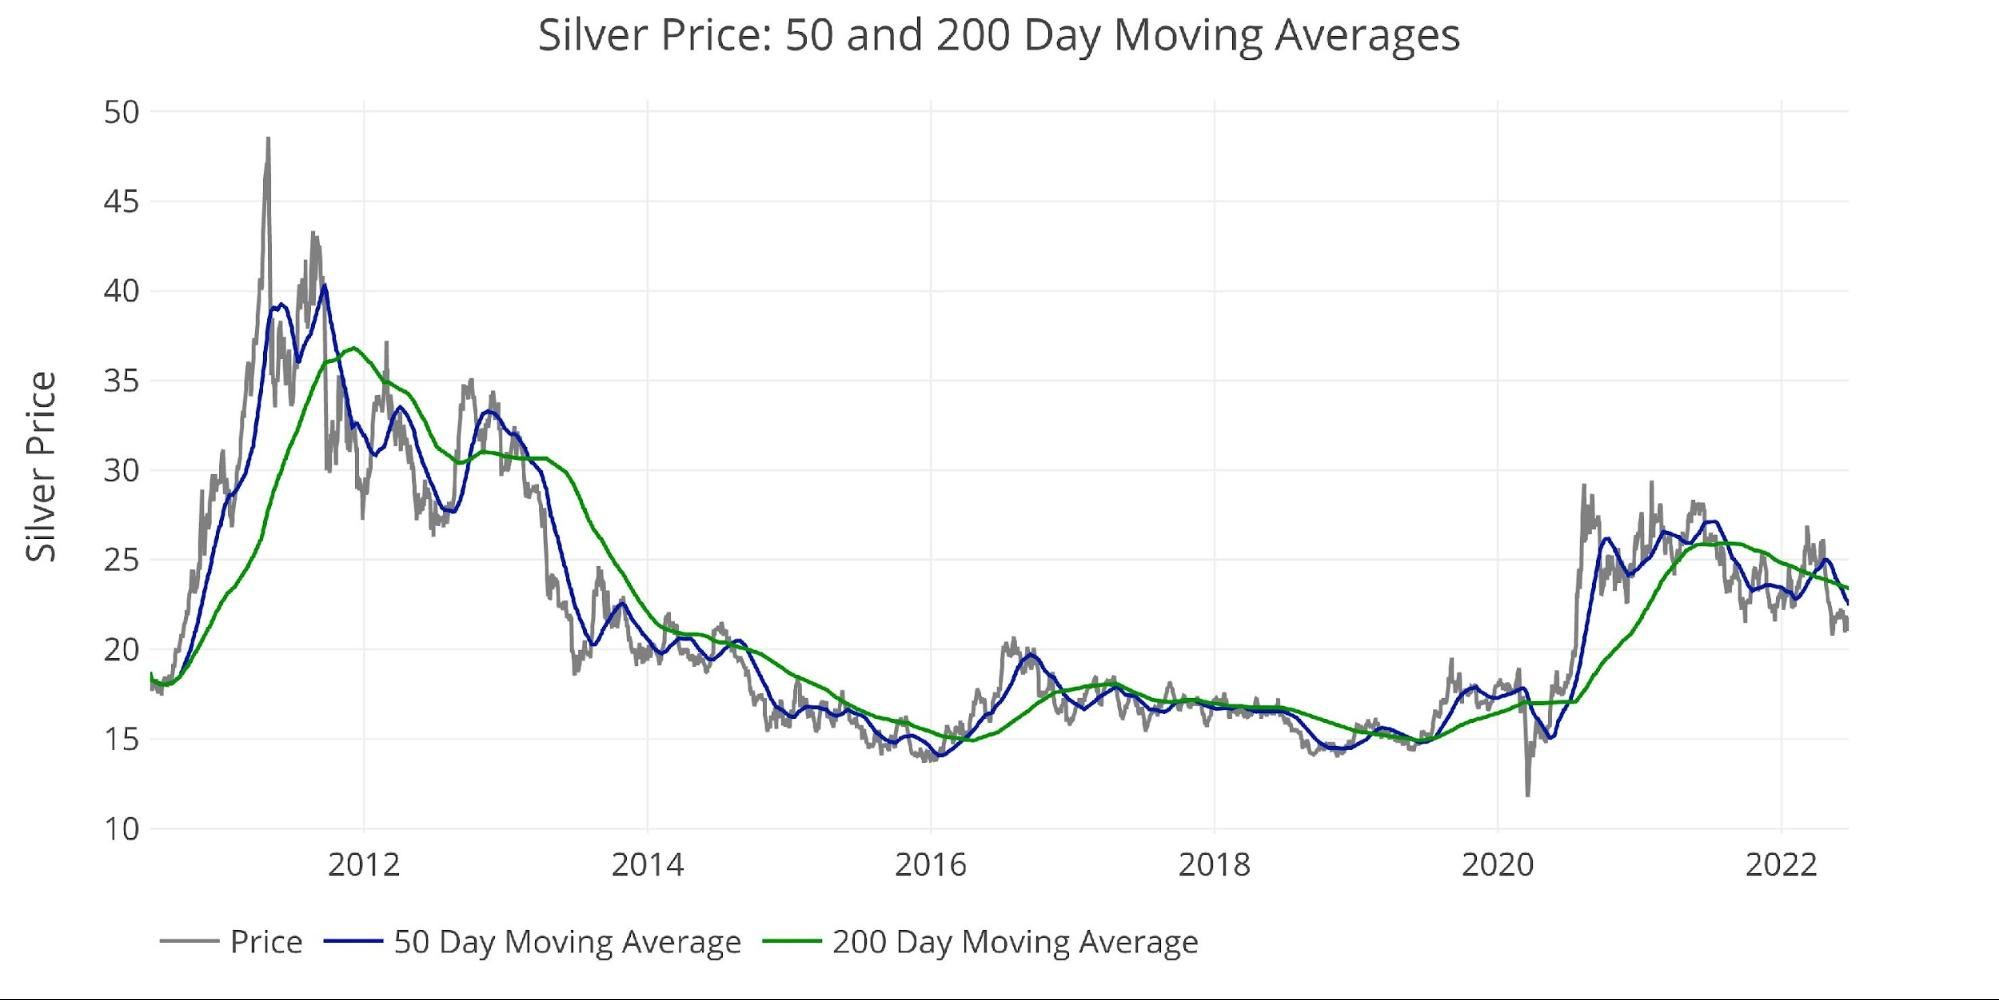
Figure: 3 Silver 50/200 DMA
Comex Open Interest
The two charts below show the open interest compared to the price in both gold and silver. The overlap is not perfect, but major moves in one generally occur in tandem with the other as speculators push and pull the price around with paper contracts.
Gold
Current open interest is hovering near the lows over the last two years (around 500k) but the price remains in the middle of that range ($1825). This means there is less downside potential and more dry powder that could push the price to new highs if it breaks through upper resistance.
Outlook: Bullish
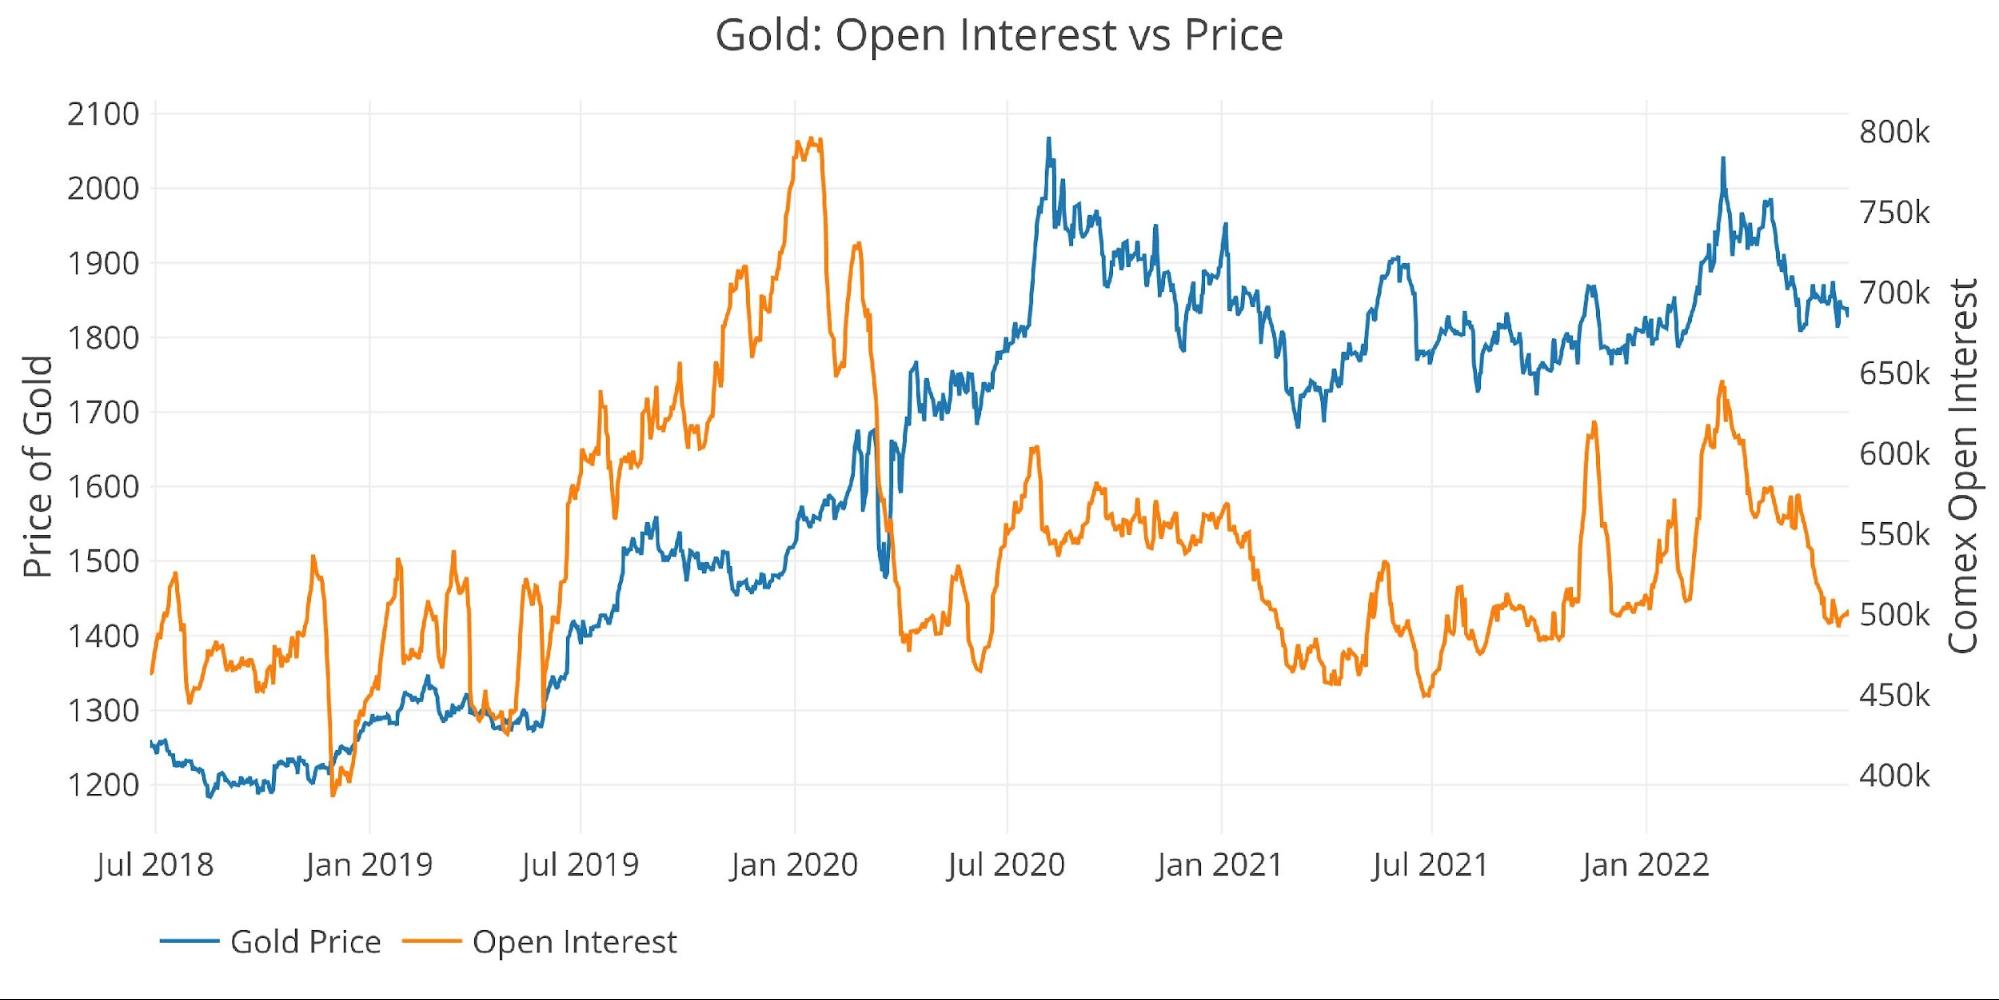
Figure: 4 Gold Price vs Open Interest
Silver
Silver open interest is near the lows not seen since March 2014 (except for the March 2020 flash crash) yet the price remains much higher than at any point over that time period. Similar to gold, this means there is dry powder and not much more selling pressure left.
Outlook: Bullish
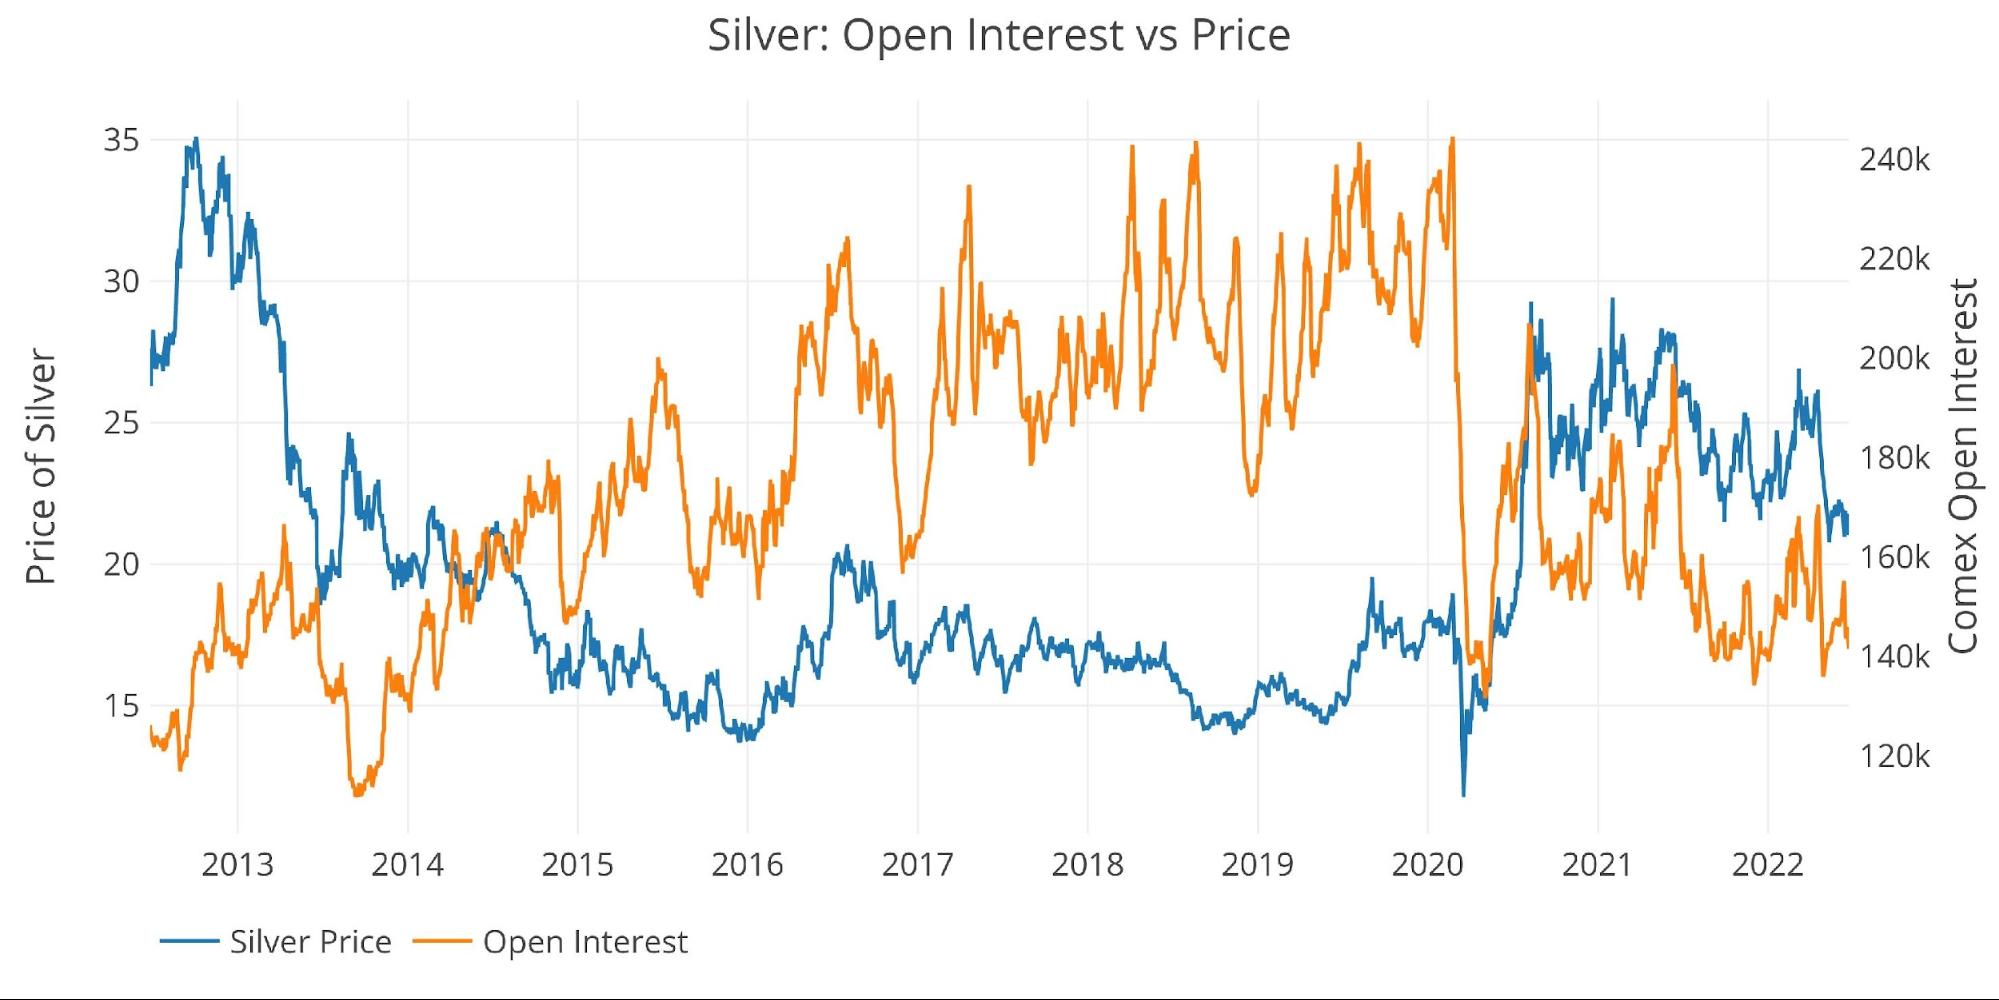
Figure: 5 Silver Price vs Open Interest
Margin Rates
Gold
Margin rates have stayed flat ever since they were raised to $7200 in the wake of the massive price surge in March. Given where open interest sits, it seems more likely margin would be lowered rather than raised at this point. They may also want to give themselves more ammunition to increase rates if the price jumps again. Lowering rates would be a tailwind.
Outlook: Bullish
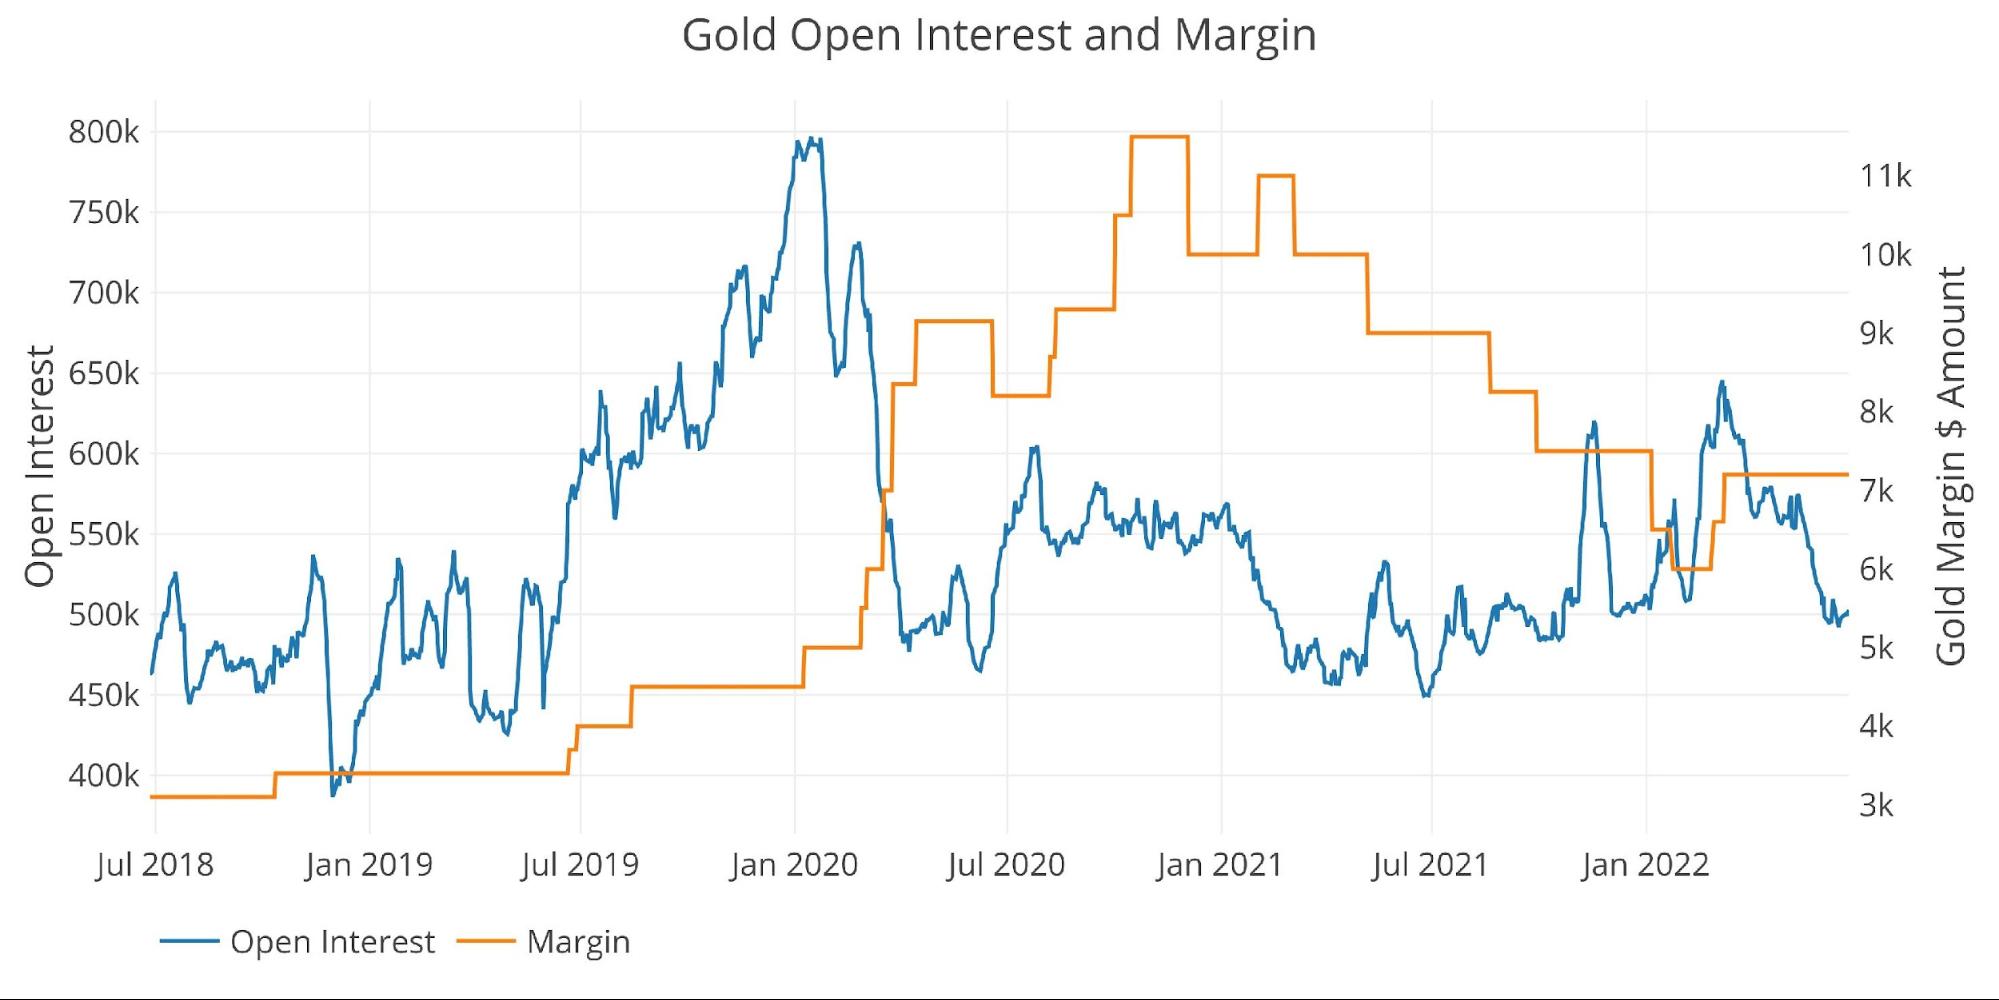
Figure: 6 Gold Margin Dollar Rate
Silver
Silver fell even as margin rates were being lowered. Rates are now below the levels from June 2020. There is plenty of room to raise rates to counteract any price advance, but there seems little reason to drop rates lower given the market uncertainty.
Outlook: Neutral to Bearish
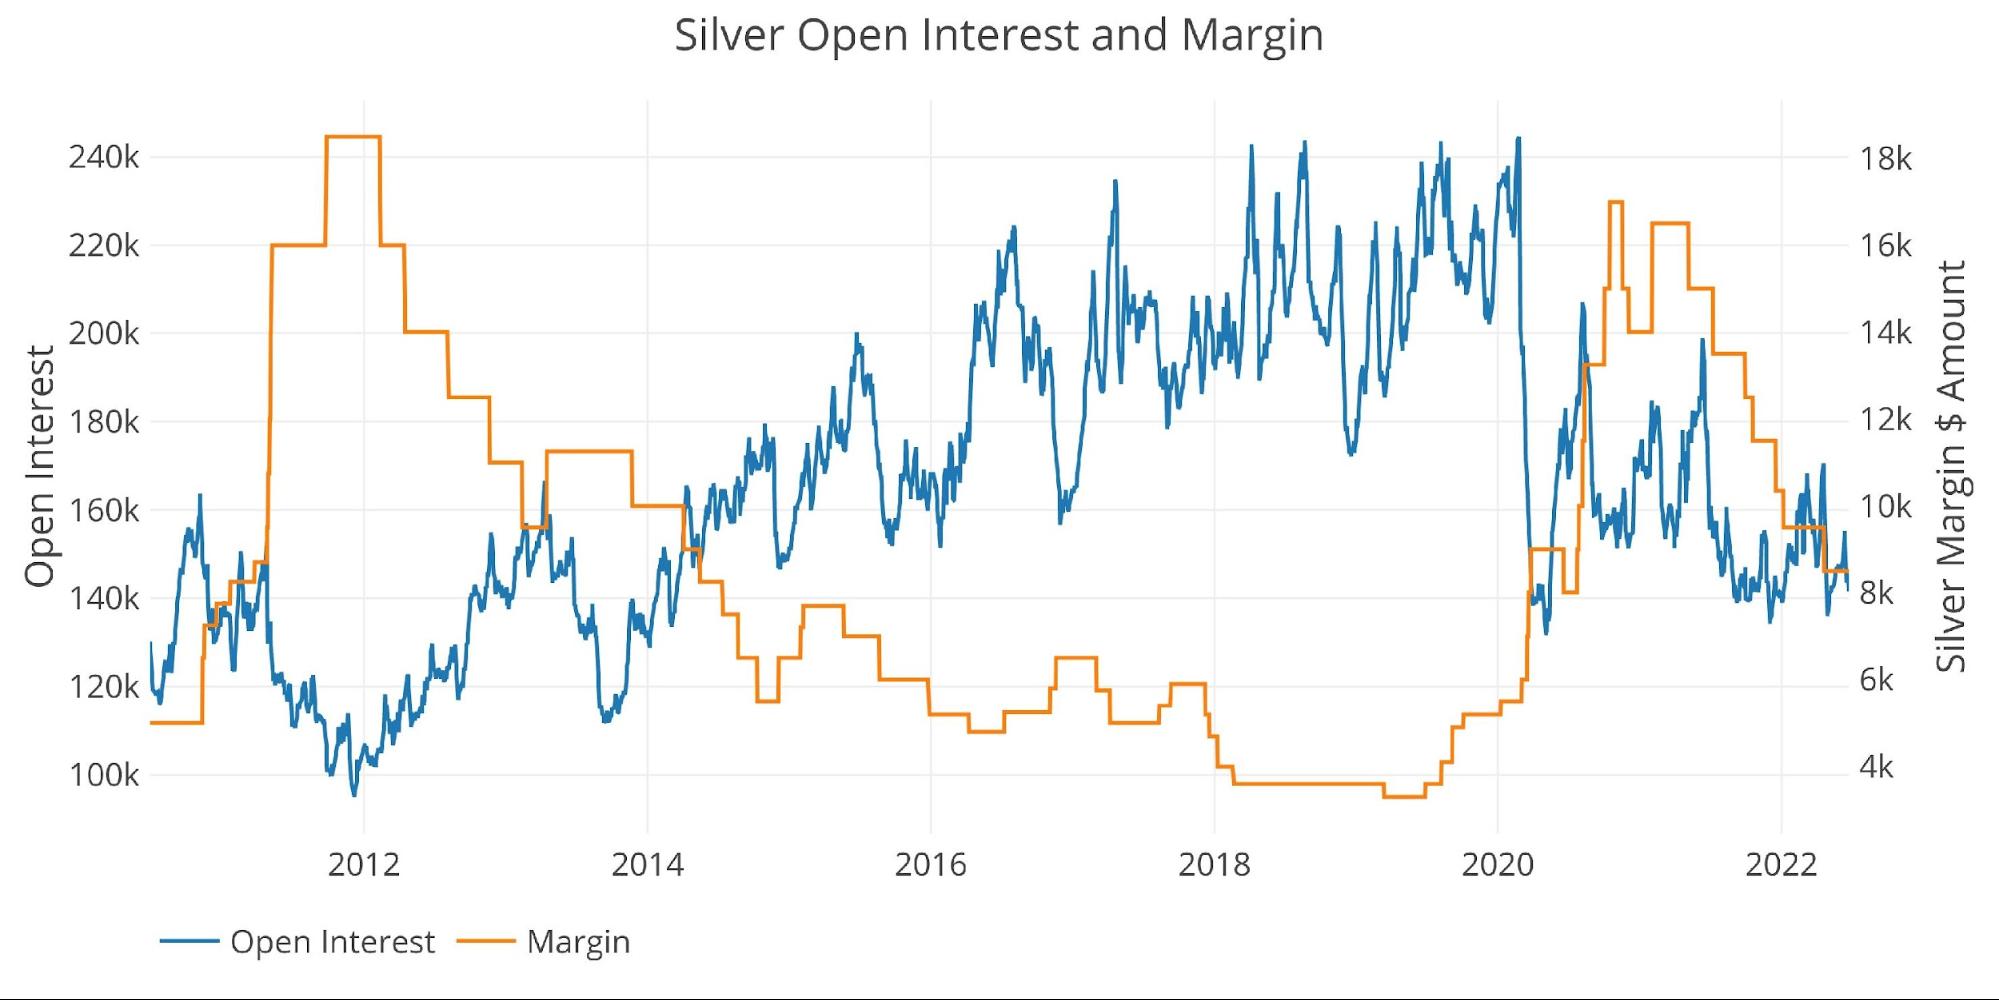
Figure: 7 Silver Margin Dollar Rate
Gold Miners (Arca Gold Miners Index)
This week was the first time in a long time that a big move down in GDX/Gold Miners did not front-run a move down in the metal. Gold was very flat both Thursday and Friday, yet the GDX saw a massive +4% sell-off on Thursday and then gained much of it back Friday, rising 2.6%.
Typically, the miners lead the metal but this week looked like a head fake. Not only that, but GDX finally made a new lower low in the current up move which could be a reset on the technical analysis. This means that GDX could be setting up for a monster rally if gold can break through overhead resistance.
Outlook: Either Bullish GDX or Bearish Gold
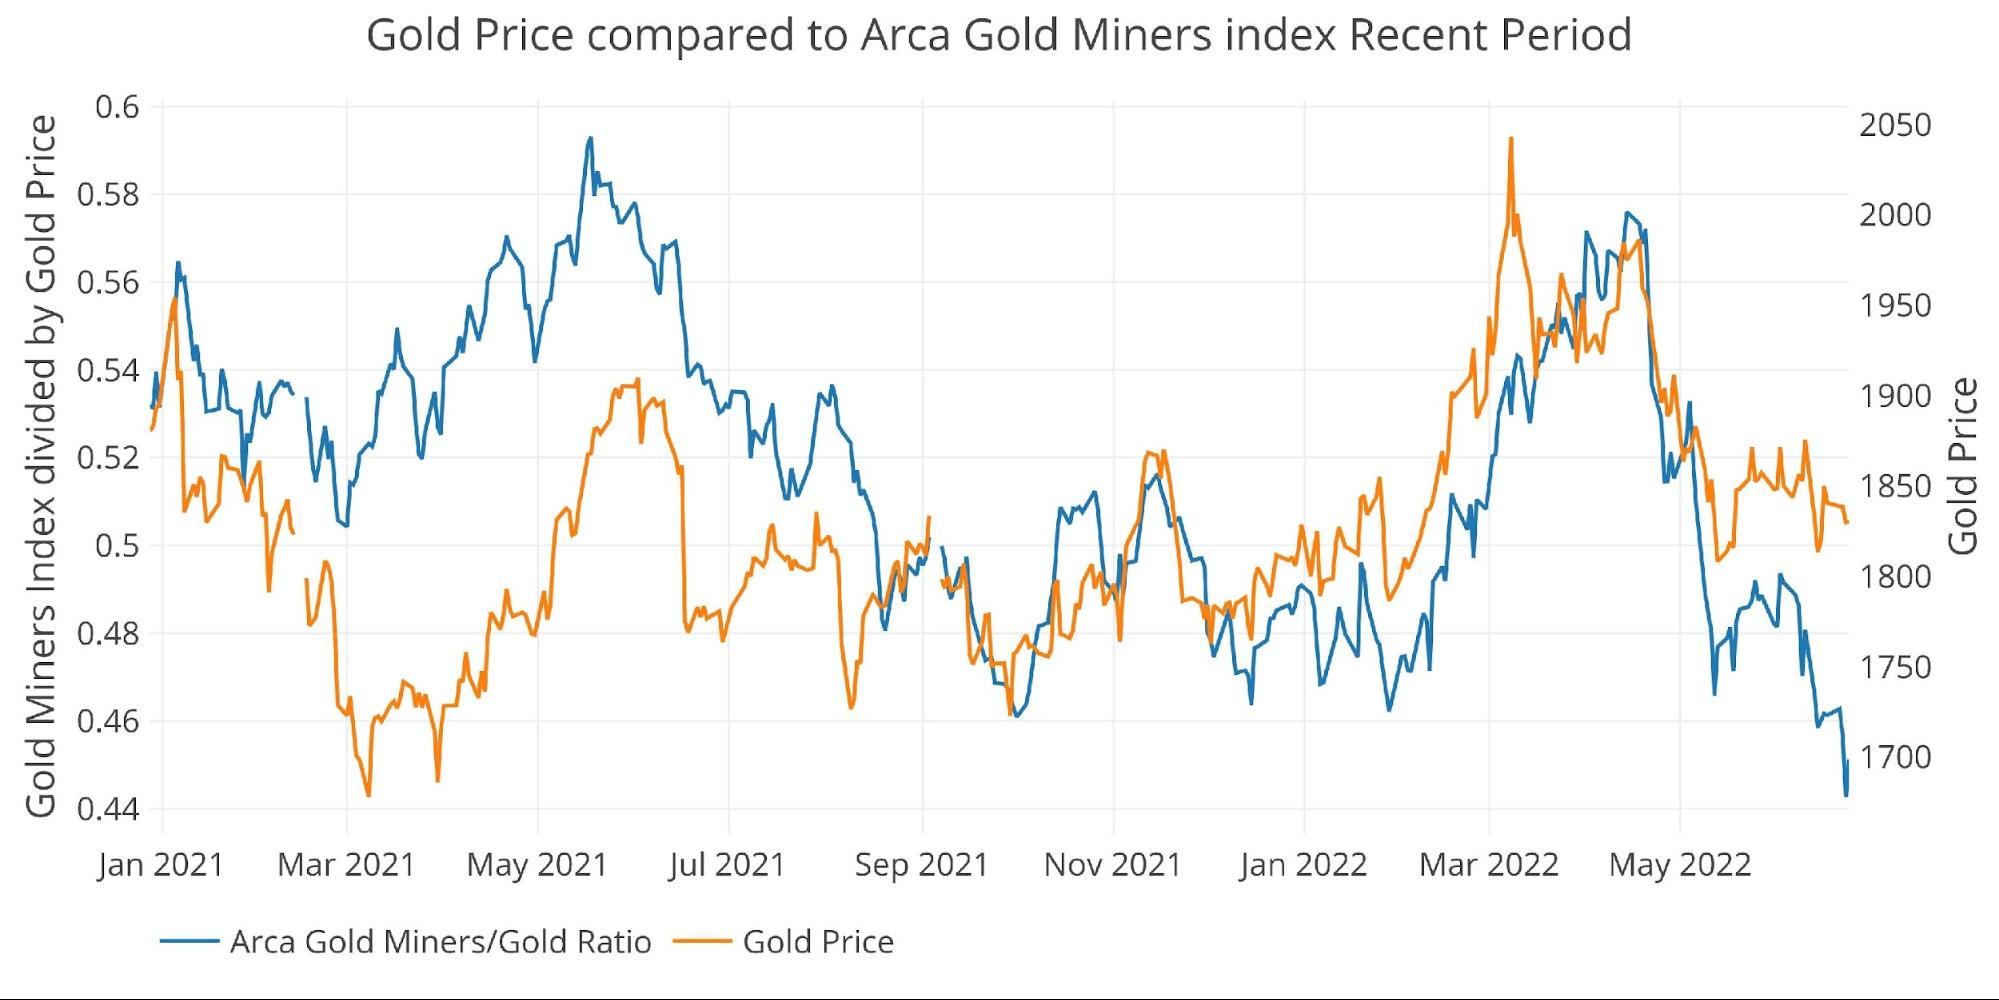
Figure: 8 Arca Gold Miners to Gold Current Trend
Looking over a long-time horizon, the HUI is not yet at all-time lows against the price of gold as shown below. That being said, it’s at the lowest point since May 2020 which is right before gold kicked into high gear. GDX has been a losing trade for a decade now, maybe it’s finally getting ready to turn a corner.
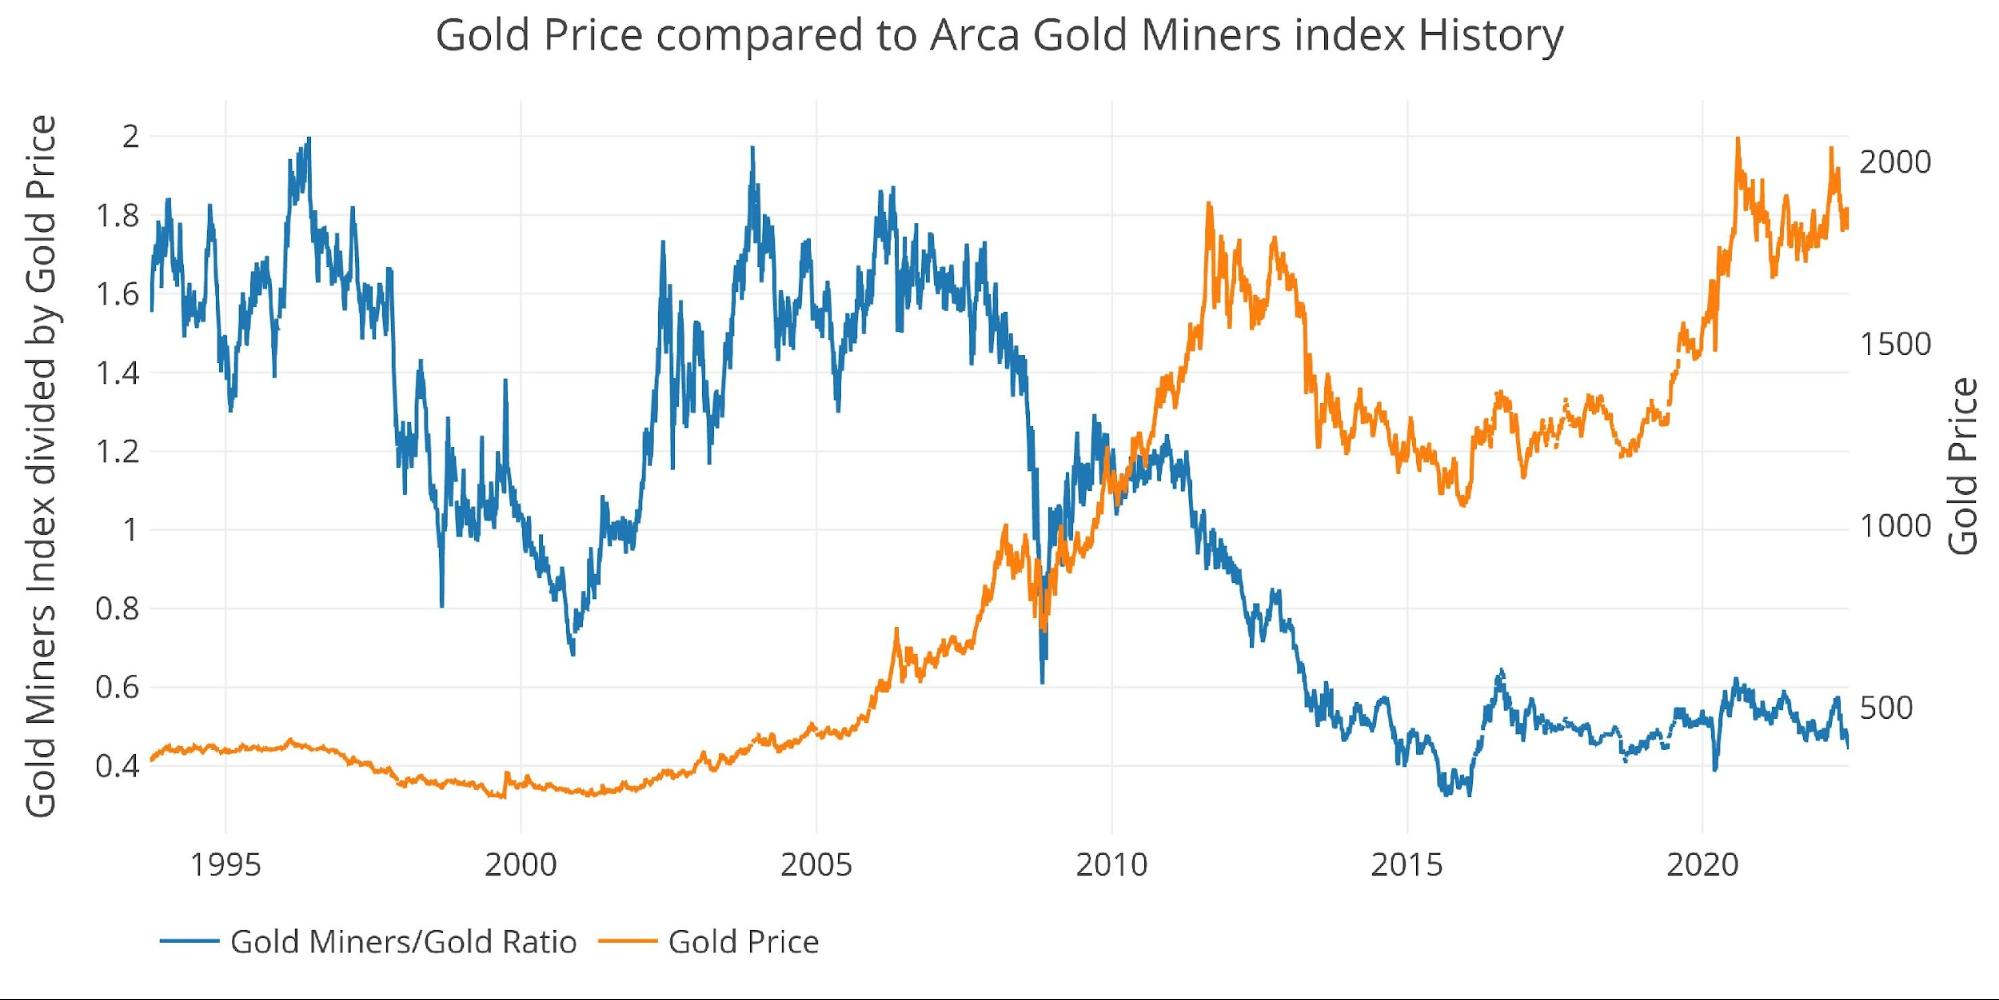
Figure: 9 Arca Gold Miners to Gold Historical Trend
Trade Volume
Love or hate the traders/speculators in the paper futures market, but it’s impossible to ignore their impact on price. The charts below show more activity tends to drive prices higher.
Trade volume in gold is back at the bottom levels which suggests downside is limited. Unfortunately for silver, it saw a spike up in trade volume but sold off rather than rallied. If trade volume were to dissipate it could push silver down further.
Bullish Gold and Bearish Silver
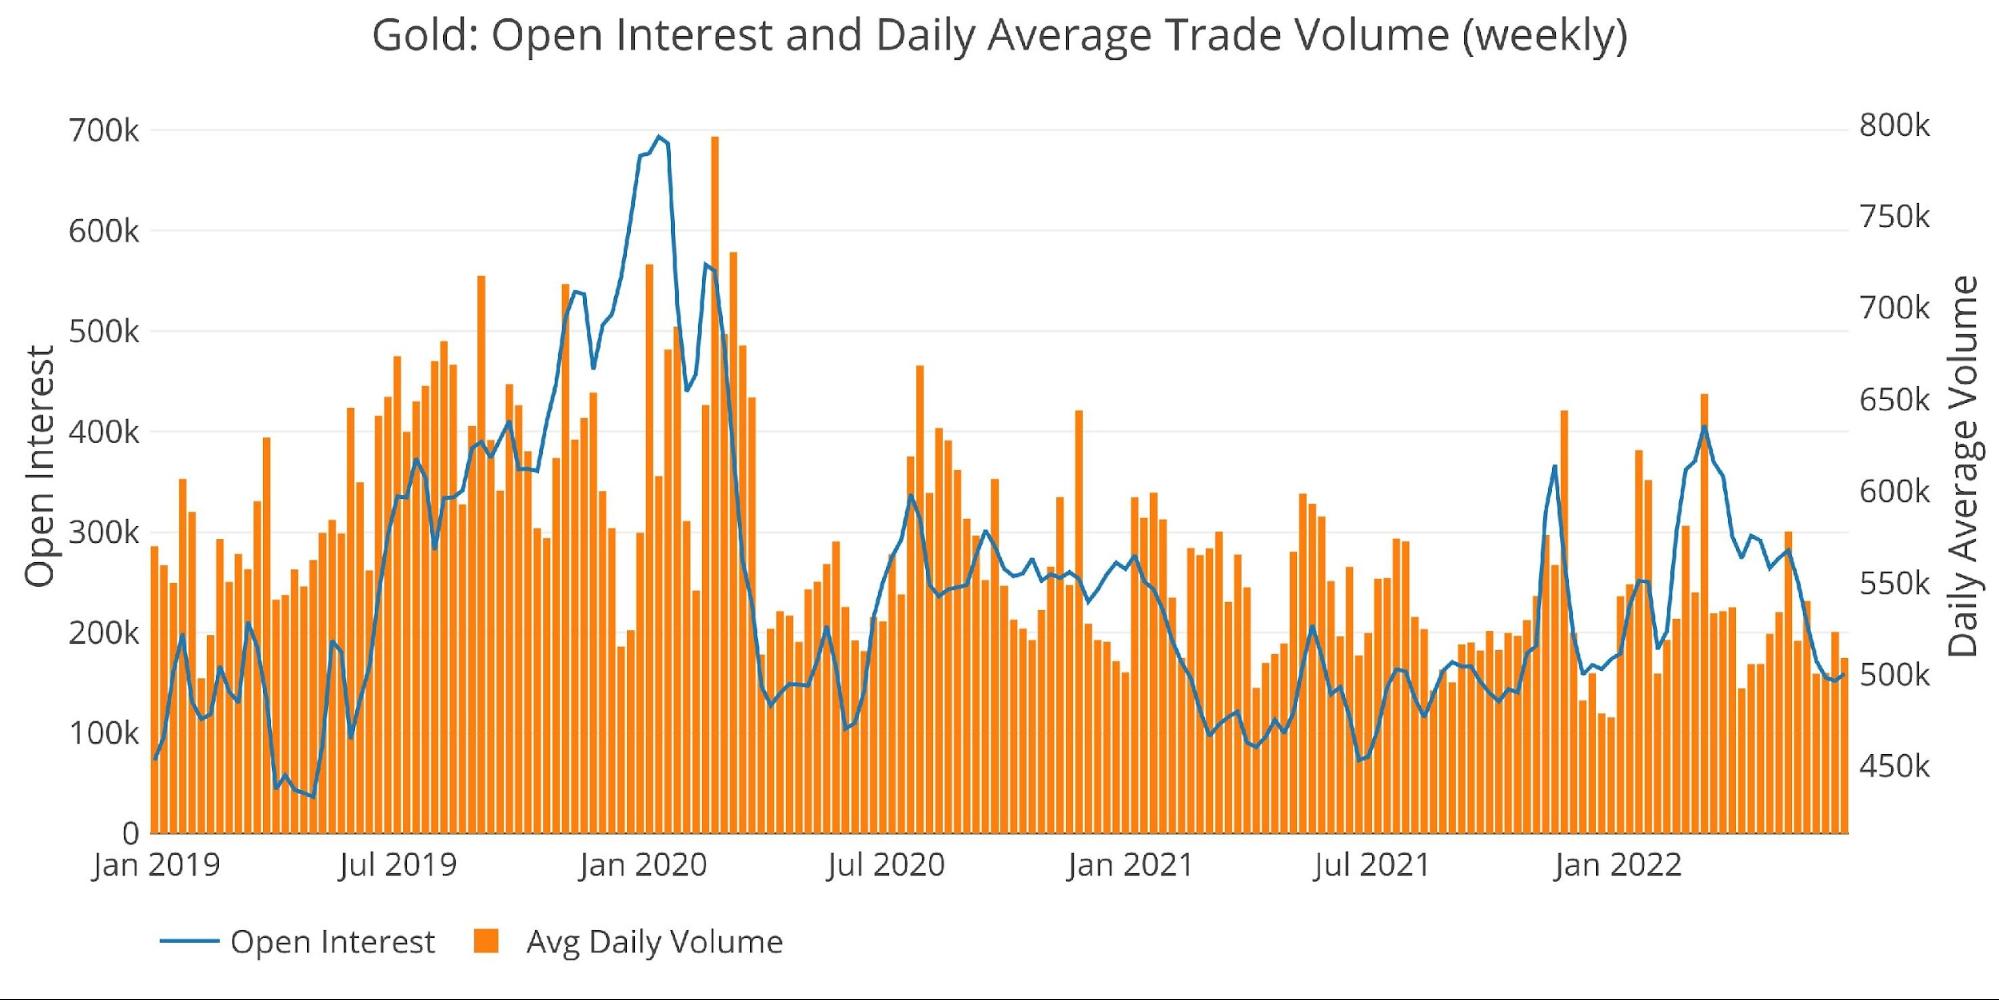
Figure: 10 Gold Volume and Open Interest
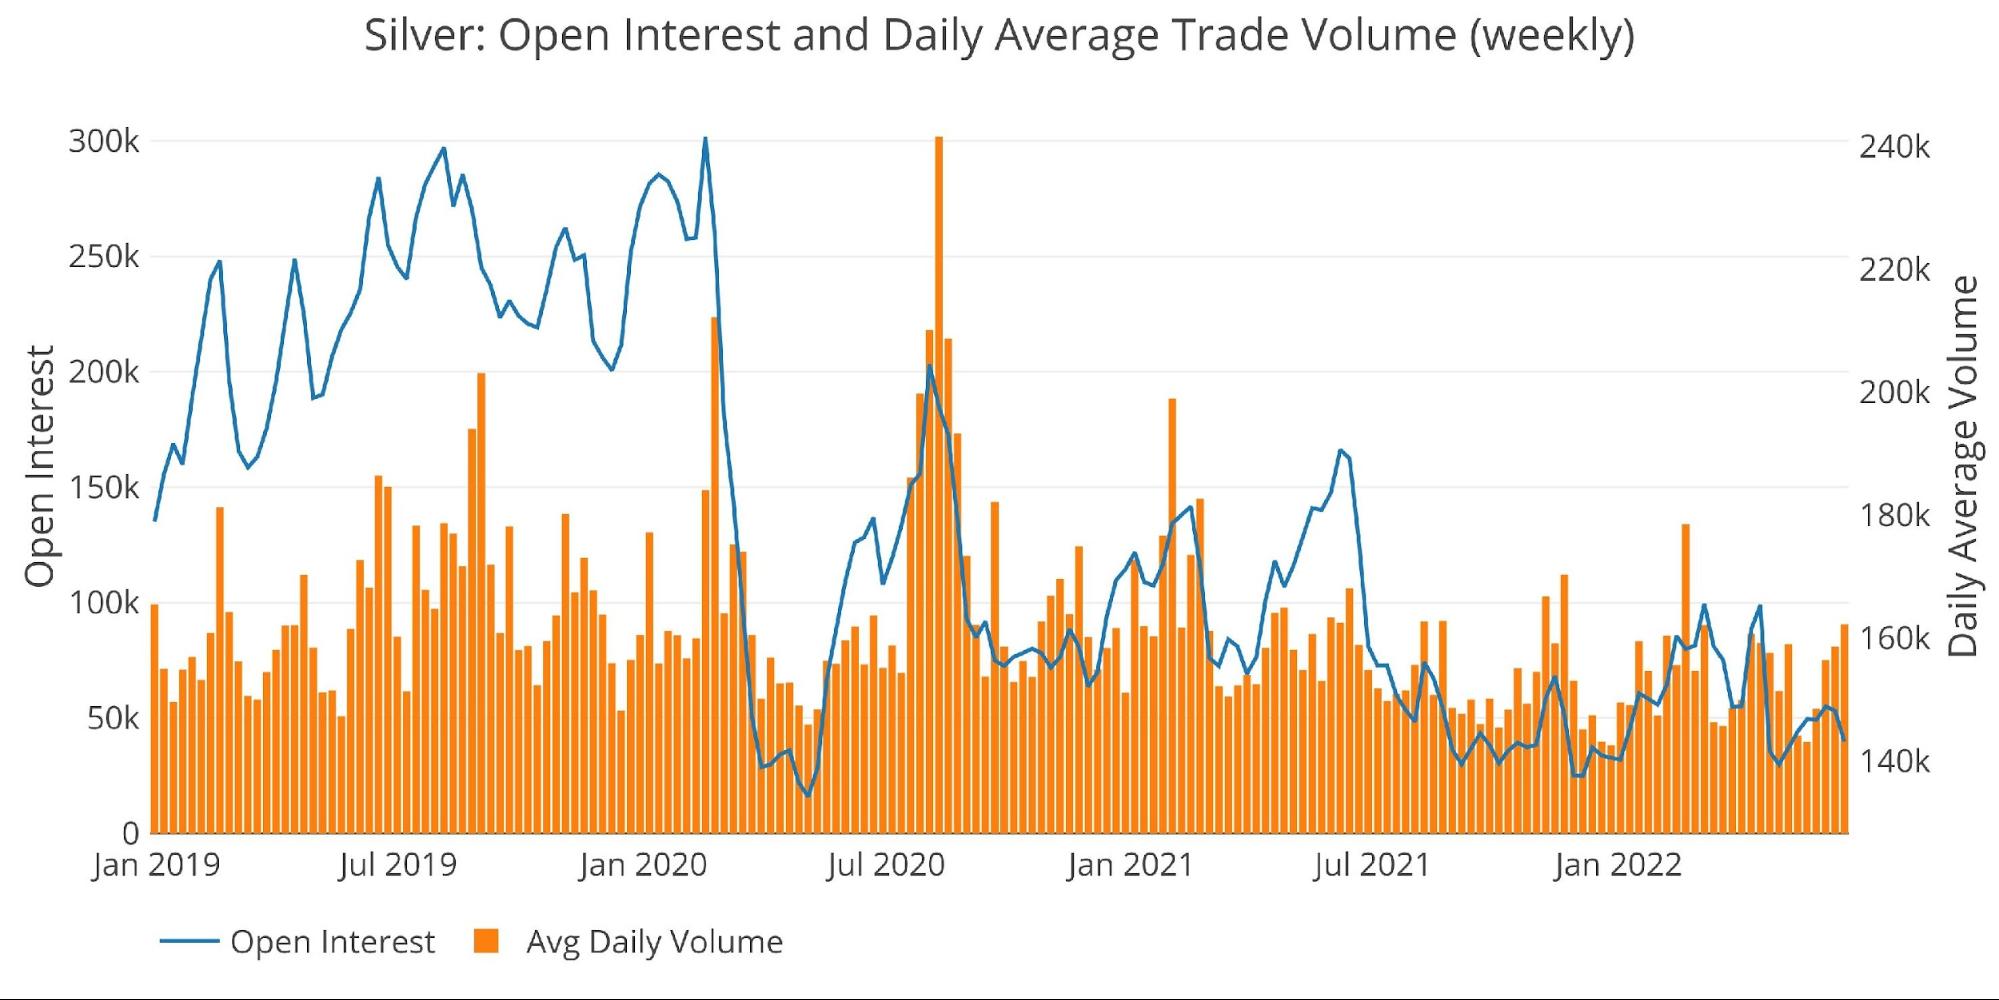
Figure: 11 Silver Volume and Open Interest
Other drivers
USD and Treasuries
Price action can be driven by activity in the Treasury market or US Dollar exchange rate. A big move up in gold will often occur simultaneously with a move down in US debt rates (a move up in Treasury prices) or a move down in the dollar.
Please note: IEF is the 7-10-year iShares ETF (a move up represents falling rates) and the Dollar return is inverted in this chart to show a positive correlation. They are also plotted on the right y-axis to show the price movement better.
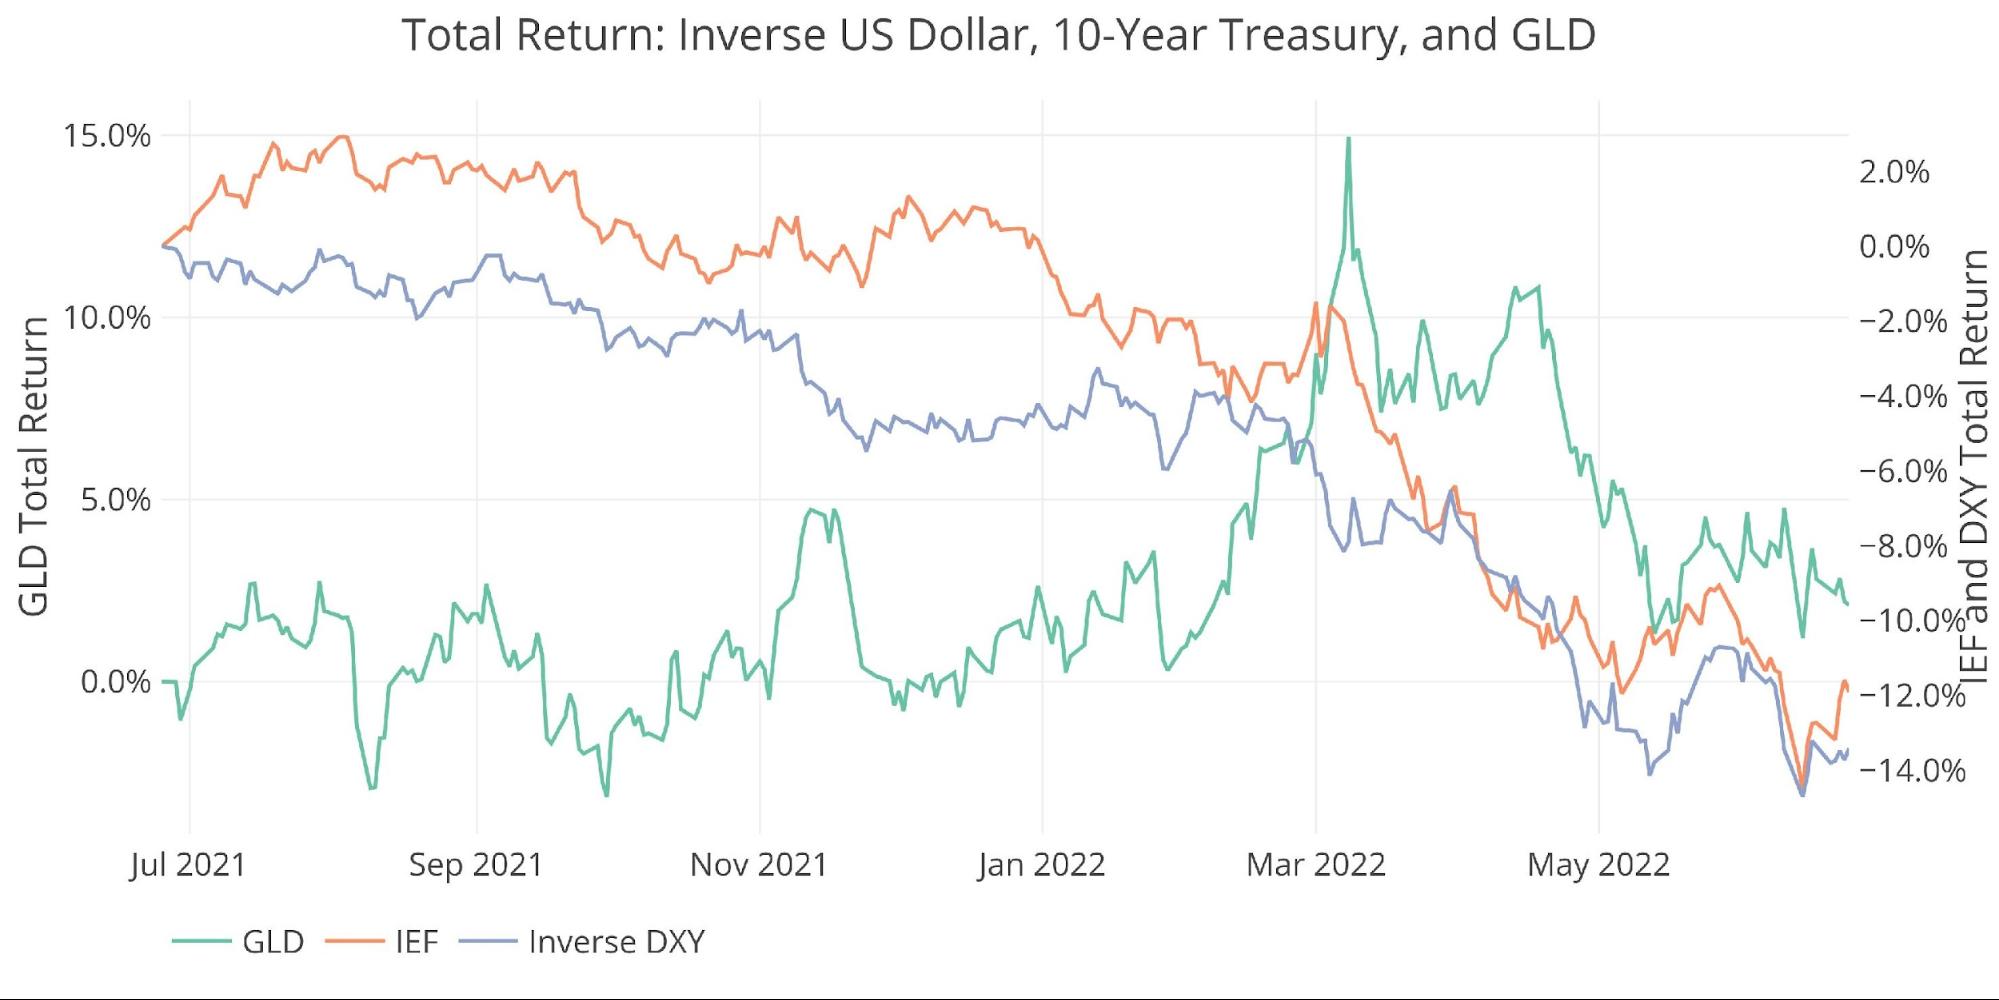
Figure: 12 Price Compare DXY, GLD, 10-year
The dollar has been on an absolute tear for months now. The DXY seems to have found some resistance finally at the 105 level. Once again, gold has held up well against a tough backdrop of rising rates and a stronger dollar. The dollar and bonds have been moving in lock step together, so until this pattern breaks gold will meet resistance with a strong dollar and rising bond yields.
Outlook: Neutral
Gold Silver Ratio
Gold and silver are very highly correlated, but do not move in perfect lock step. The Gold/Silver Ratio is used by traders to determine relative value between the two metals. Historically, the ratio averages between 40 and 60, so outside this ban can indicate a coming reversion to the mean.
Silver is definitely outside the band which means either gold will fall or silver will need to catch up.
Outlook: Silver VERY Bullish relative to gold
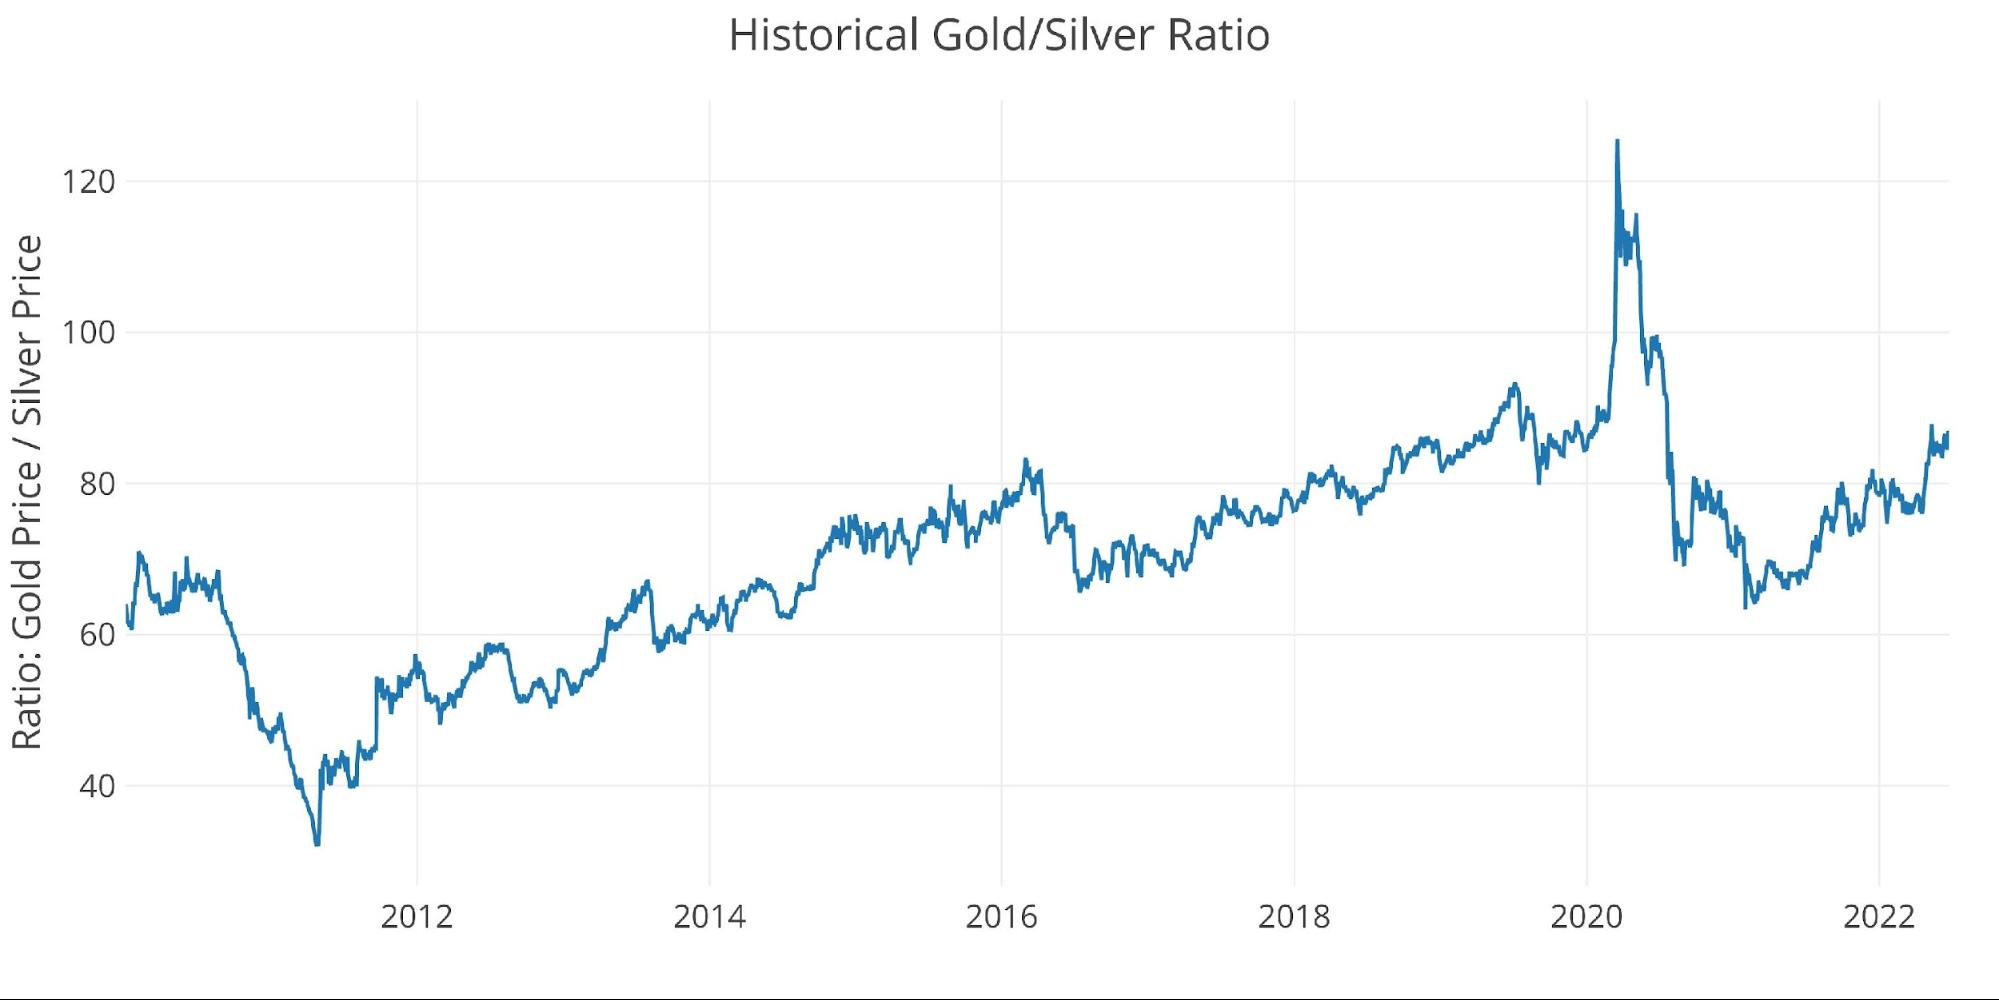
Figure: 13 Gold Silver Ratio
Bringing it all together
The table below shows a snapshot of the trends that exist in the plots above. It compares current values to one month, one year, and three years ago. It also looks at the 50 and 200-daily moving averages. While DMAs are typically only calculated for prices, the DMA on the other variables can show where the current values stand compared to recent history.
The charts above show that the bearish move may have run its course, setting up for a reversal.
-
- Over the last month, open interest and the HUI index are down 5.2% and 9% respectively. Trade volume is well below the 50 and 200-day moving averages (by ~30%). Gold has only fallen 2.2% over the same time, showing resilience.
- Compared to three years ago, open interest is 12.5% lower but the price is 29% higher
-
- This demonstrates how traders can move the price in the short-term, but fundamentals are winning long-term
-
- Silver open interest is down 17.5% from a year ago which mirrors the down move in the price (-19.5%)
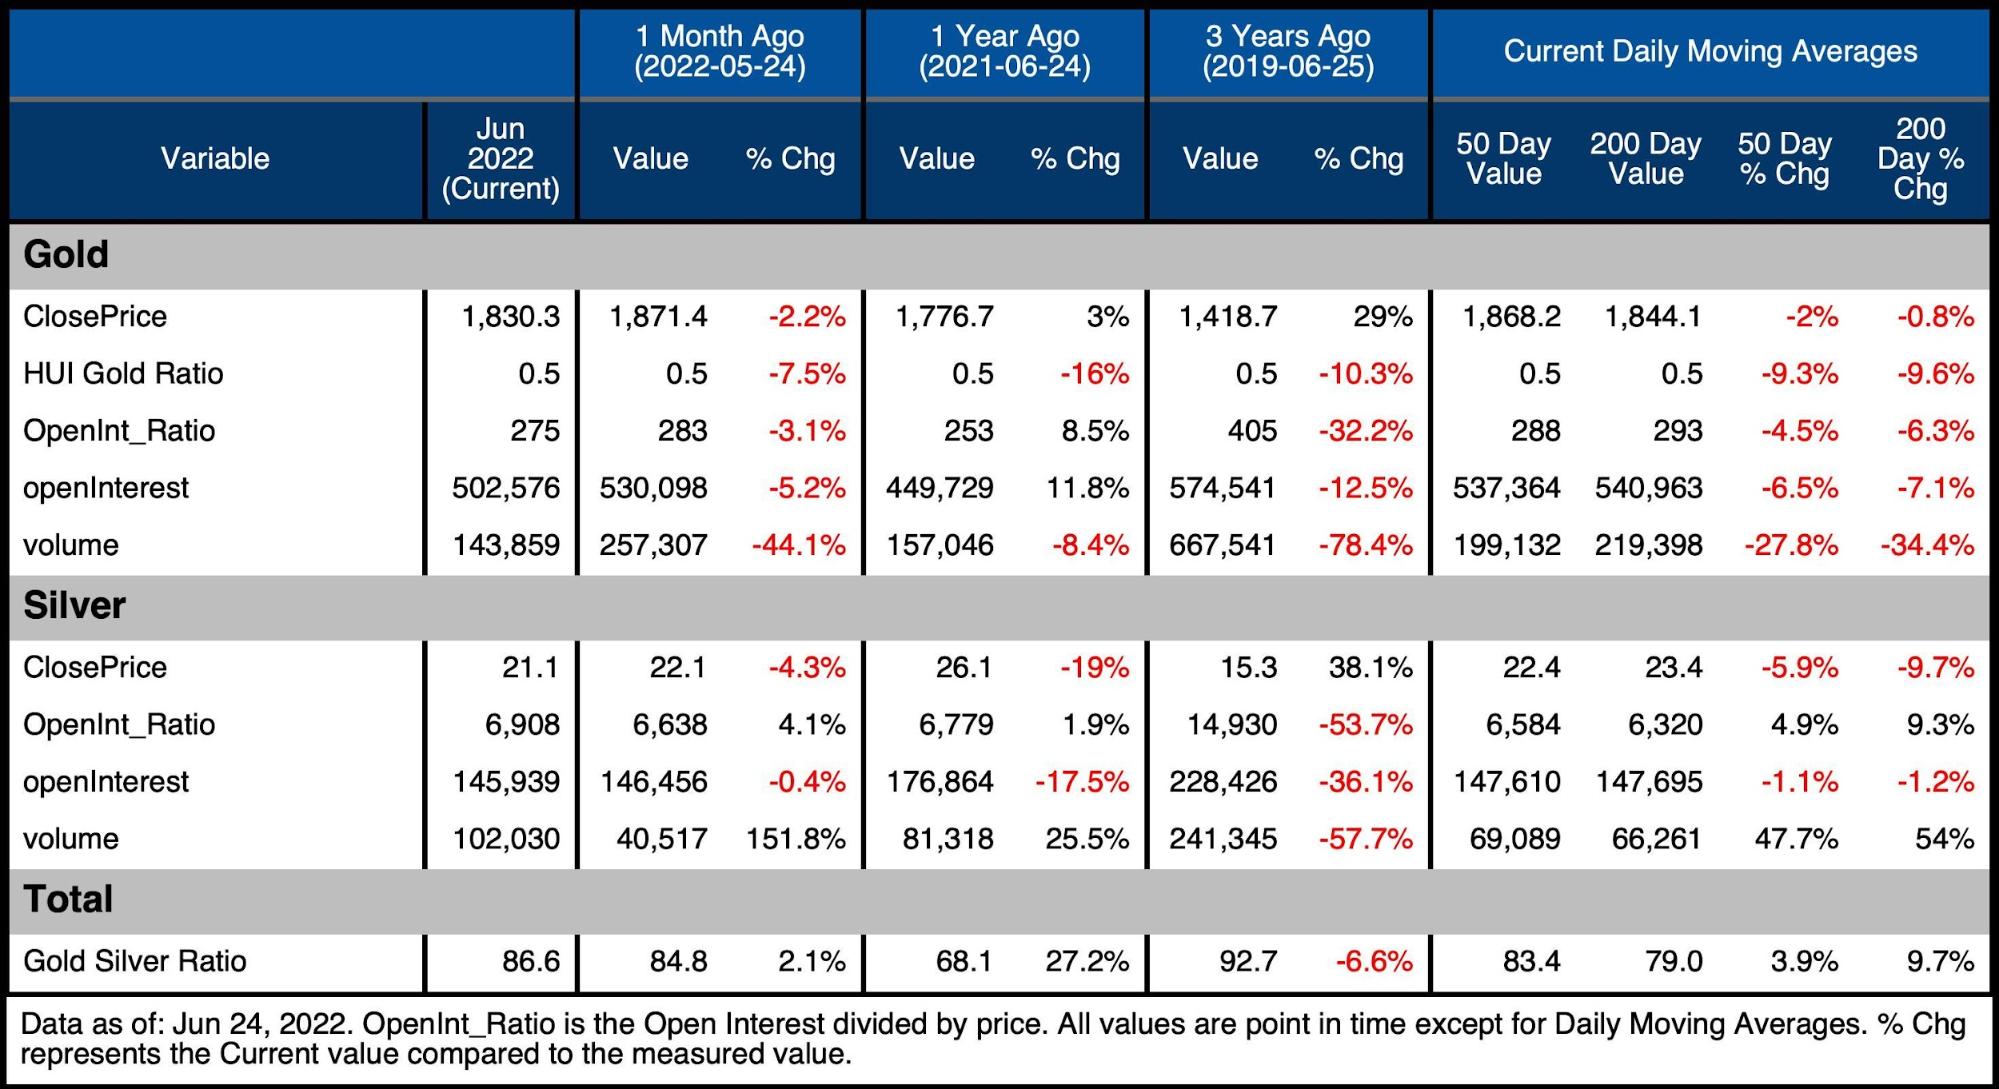
Figure: 14 Summary Table
Wrapping up
Last month discussed how the down move looked to have run its course. The recent data confirms this and a healthy bottoming pattern has taken hold. The sideways action can be frustrating but is also healthy. It builds a base on which to launch from.
Gold definitely looks to have more upside potential than downside. Silver on the other hand is in a bit harder spot. This makes sense given its dual purpose as an industrial and monetary metal. Regardless, over the medium and long-term, silver should follow gold higher and even outperform.
It’s hard to think how the Fed will get more hawkish in the months ahead. Even if inflation continues surprising to the upside, other economic indicators like jobs and GDP are already flashing recession. Rising rates are wreaking havoc across the housing market and the Federal debt market.
The market will soon find out that the Fed has a lot more bark than bite. When this happens, gold will blast through several overhead resistance zones and find a new range probably north of $2,000. Of course, the Fed could always stick to its guns and keep hiking rates to rein in inflation. In this scenario, every market on Earth could start to implode. Potentially deflationary, but having physical metal is still insurance against such an event.
Data Source: https://www.cmegroup.com/ and fmpcloud.io for DXY index data
Data Updated: Nightly around 11 PM Eastern
Last Updated: Jun 24, 2022
Gold and Silver interactive charts and graphs can be found on the Exploring Finance dashboard: https://exploringfinance.shinyapps.io/goldsilver/

Call 1-888-GOLD-160 and speak with a Precious Metals Specialist today!
Buka akaun dagangan patuh syariah anda di Weltrade.
Source link