The latest seasonally adjusted inflation rate for May came in scorching hot at 0.98% MoM and 8.62% YoY, beating expectations of 0.7% and 8.3% respectively. All prices rose in May with 9 of 11 categories rising faster than the 12-month trend, representing 97.5% of the total CPI.
One thing to note is that YoY inflation may dip next month as last June’s .89% comes off the trailing 12 month. That being said, July – September are all below .5% which suggests that as the summer drags on, inflation will likely be making new highs. It’s also entirely possible that June comes in hotter than .89% and creates a new 40-year high next month. Under this scenario, inflation will almost certainly hit double digits by September.

Figure: 1 Month Over Month Inflation
The YoY chart shows that even as Commodities (e.g., Used Cars) has started to cool some, the rest of the components are driving the price advances.

Figure: 2 Year Over Year Inflation
The chart below compares the current month to the 12-month average. Only Waste Management and “Other” were below the 12-month trend which compromise 2.5% of the CPI.
- Energy was up 3.9% vs a 2.5% 12-month average
- Shelter, the largest component, was up .6% vs .4% average
- Commodities have slowed some but are still up .69% vs .68% 12-month average
How can anyone assume peak inflation has been reached when nearly all components are still accelerating? Not to mention the point above about July – September 2021 being replaced with 2022 numbers.

Figure: 3 MoM vs TTM
The table below gives a more detailed breakdown of the numbers. It shows the actual figures reported by the BLS side by side with the recalculated and unrounded numbers. The weighted column shows the contribution each value makes to the aggregated number. Details can be found on the BLS Website.
Some key takeaways:
- According to the BLS, Shelter is up 5.45% YoY, but market reports show rent increases closer to 13%!
-
- Owners Equivalent Rent continues to massively understate the market, up only 5.1% YoY in the CPI
-
- Food is up more than 10% YoY
-
- This could get worse as the Ukraine/Russia conflict disrupts core food production
- Meat/Poultry/Fish/Eggs were up 14.2% YoY
- Dairy and Alcohol were up 12% YoY
- Food away from home was “only” up 7.4%
-
- Energy is up an incredible 34.35% YoY
- Airfares are up 12.6% MoM and 37.8% YoY! This is on the heels of rising 18.6% in April and 10.7% in March
These numbers are simply astonishing. Many of the monthly gains would be shocking if they were annual gains.
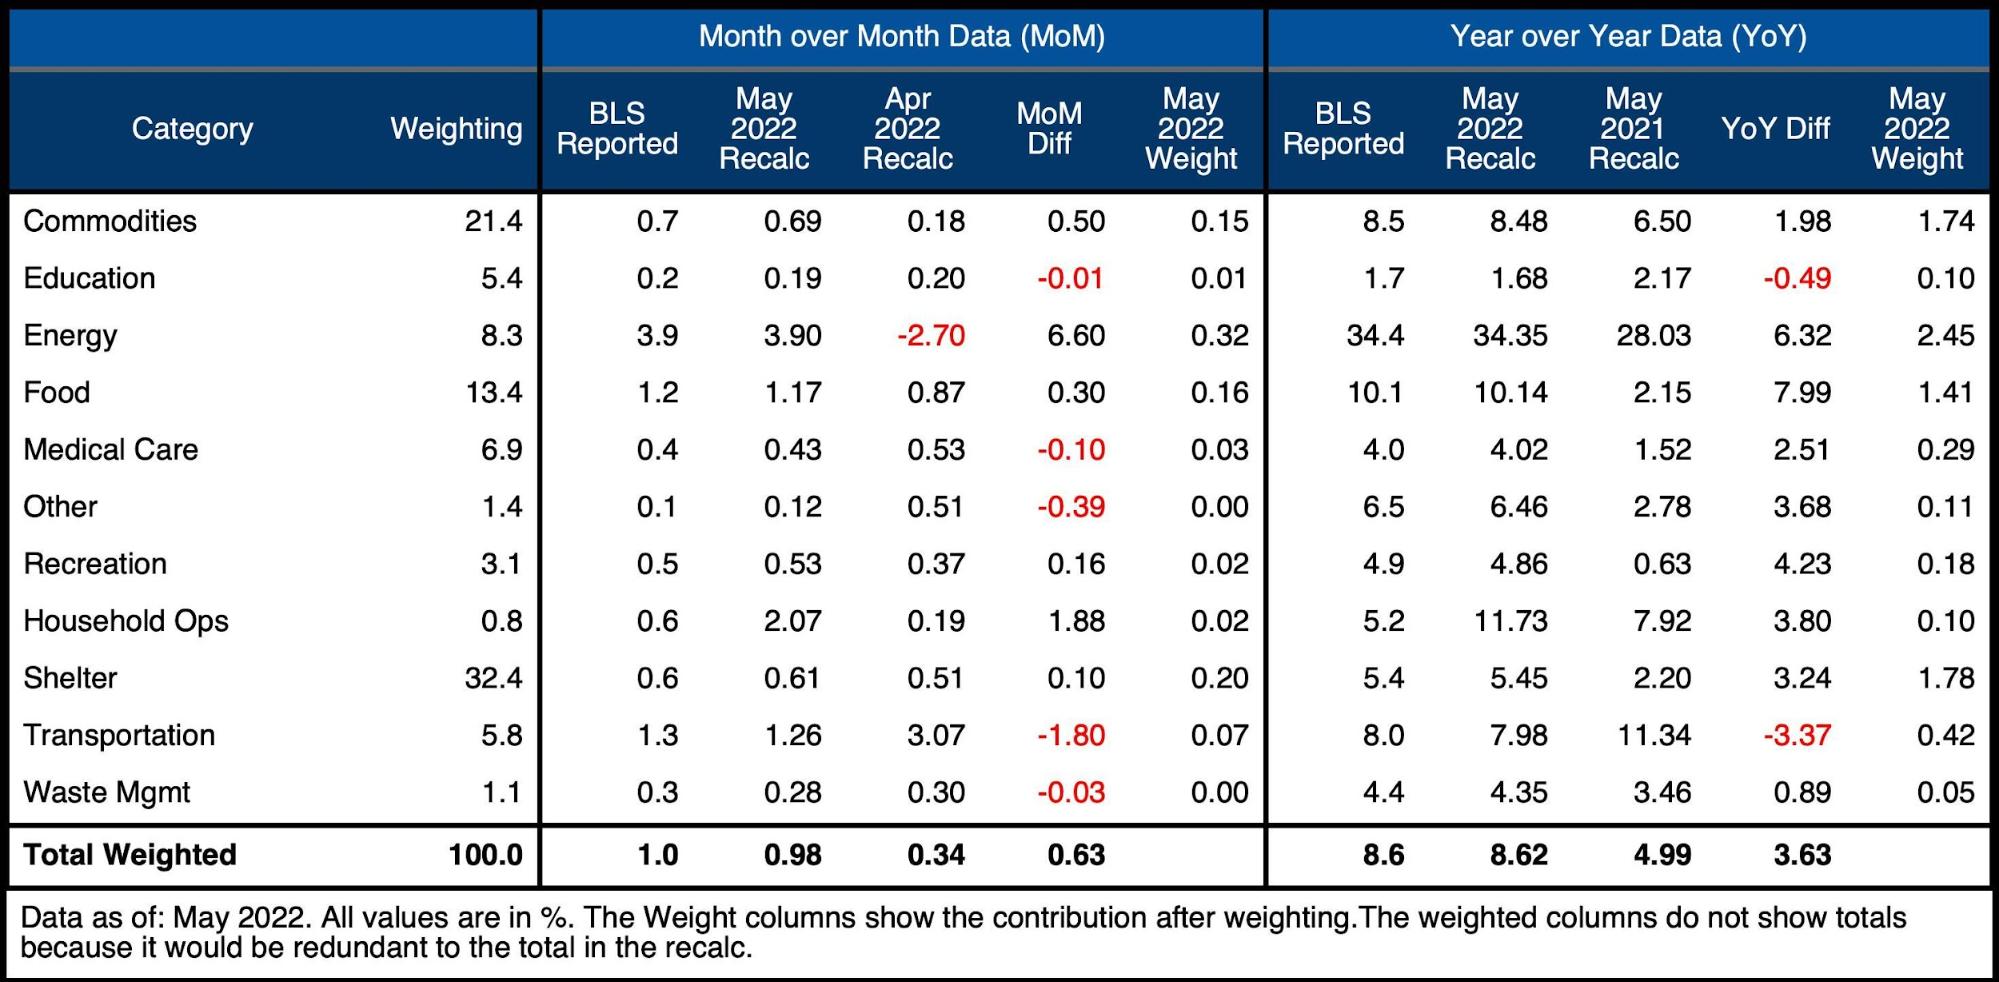
Figure: 4 Inflation Detail
Looking at the Fed Numbers
While the Fed does have different categories, its aggregate numbers match the BLS.
Their data goes back to the 1950s. Unfortunately, they do not publish the weightings of each category so it would be impossible to do a similar analysis showing the impact of each category on the overall number.
Looking at history back to 1950 puts the current spike into perspective. Remember that if the methodology was the same, inflation would likely be above 15% already!
How has the Fed responded historically to very high inflation? Increasing the Fed Funds rate to above the rate of inflation (gray line). This time around, the response by the Fed is so weak it can barely be seen (tiny uptick on the far right side). The Fed is miles behind inflation and still hoping it will slow on its own.
The Fed will not be slowing down inflation with their weak and very late rate hikes. However, they will most certainly prick the everything bubble. Their meager interest rates are already being felt by the Treasury which owes an extra $40B a year on interest payments just since the start of the year.

Figure: 5 Fed CPI
Using the Fed categorical data, which is different than the BLS, shows that all but one category are above the 12-month trend. Not only have they completely missed the boat on transitory inflation, but they continue to underestimate the rate of inflation going forward.
Consumers seem to have given up believing the Fed. The Michigan Consumer Sentiment numbers have hit an all-time low. Inflation expectations have jumped from 3.3% in May to 5.4% in June! Inflation expectations are completely unanchored!
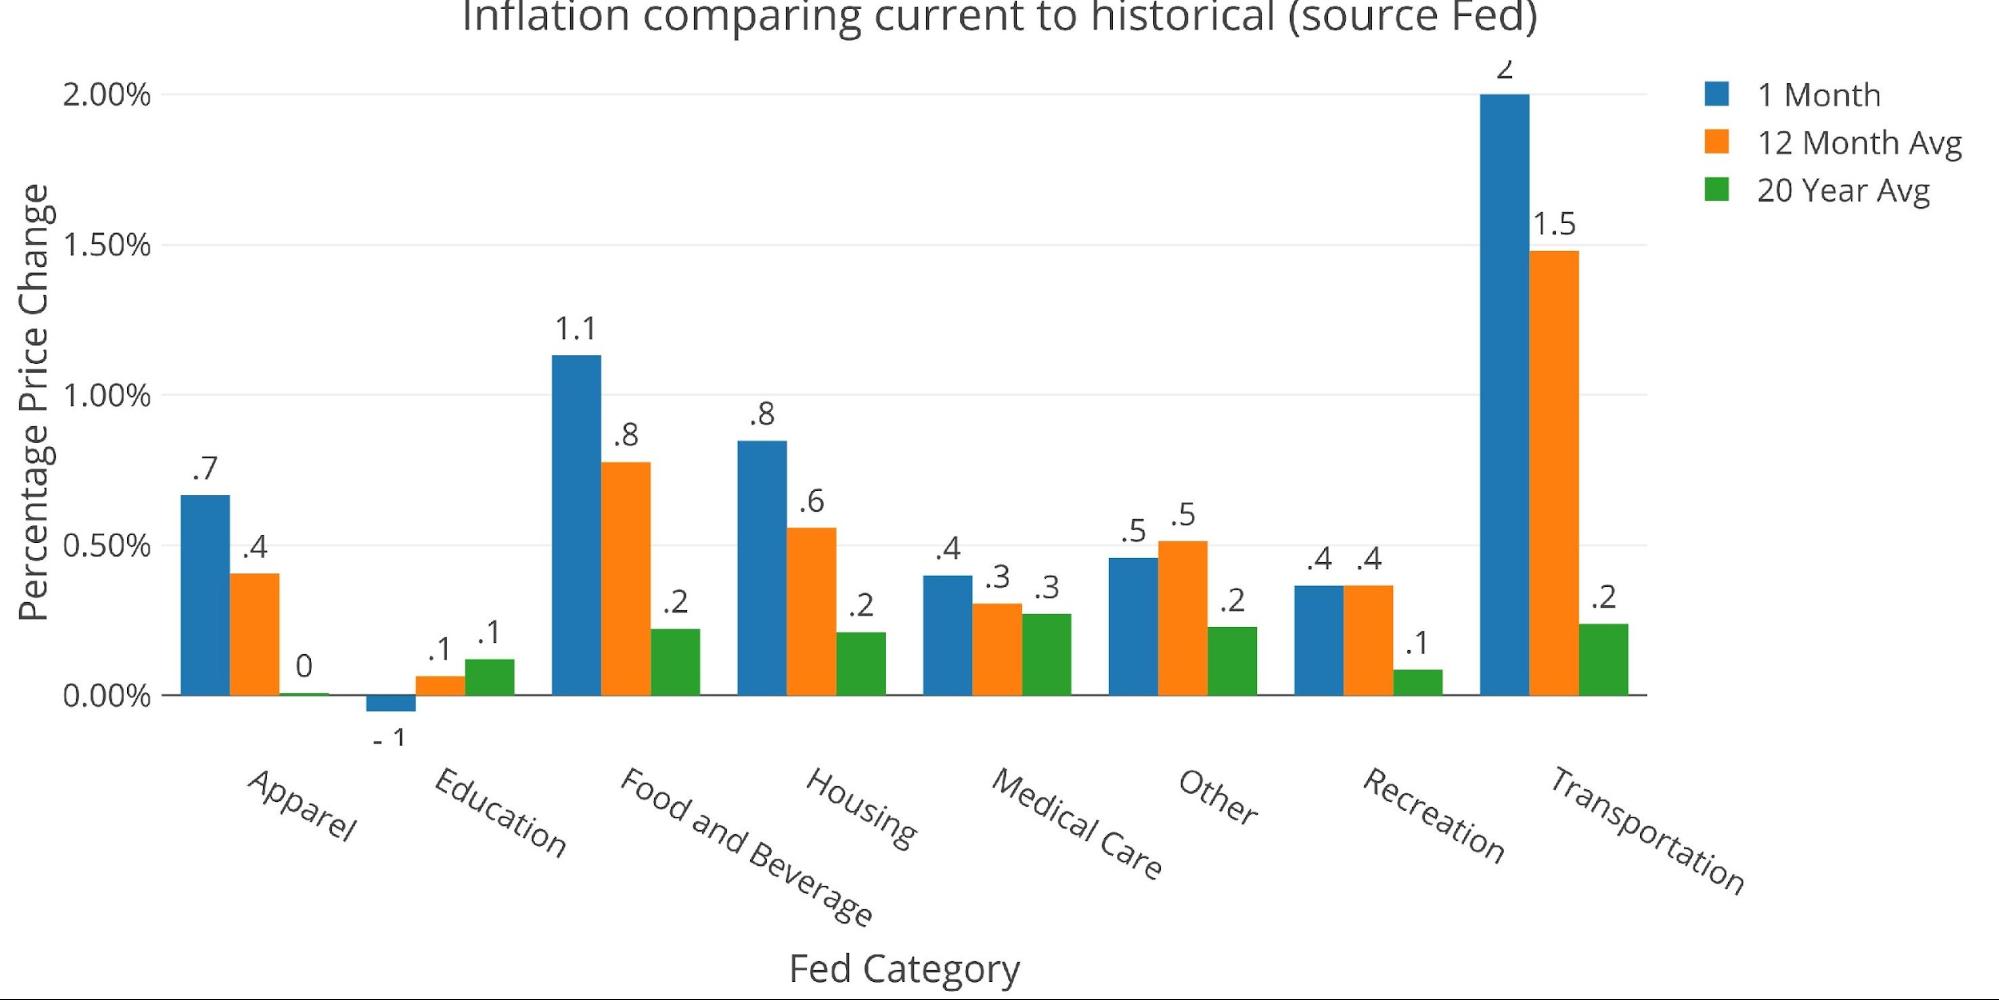
Figure: 6 Current vs History
Historical Perspective
The BLS weightings have only been scraped back to 2012, thus the chart below shows the past 10 years of annual inflation data, reported monthly. The volatility in Energy can be seen clearly over this time period.

Figure: 7 Historical CPI
What it means for Gold and Silver
The Fed is still fueling this inflation fire with real interest rates deeply negative and a bloated balance sheet. QT is not happening soon enough or aggressively enough. They have been dragging their feet on rate hikes hoping that inflation falls on its own.
The Fed seems oblivious to the fact that they caused inflation, which means they have to be the ones to solve it. This would require raising rates above the rate of inflation. The longer they wait the worse inflation gets. But they cannot raise rates above inflation because it would cause economic Armageddon.
Each month the Fed gets closer to the ultimate decision when it is forced to decide whether to save the dollar or everything else. It won’t be neither and will most likely be both.
The Fed is ignorant and blind. The market has completely underestimated the Fed’s ineptitude. One day the market will wake up, and at that point, physical gold and silver will not be available at current prices.
Data Source: https://www.bls.gov/cpi/ and https://fred.stlouisfed.org/series/CPIAUCSL
Data Updated: Monthly within first 10 business days
Last Updated: May 2022
Interactive charts and graphs can always be found on the Exploring Finance dashboard: https://exploringfinance.shinyapps.io/USDebt/

Call 1-888-GOLD-160 and speak with a Precious Metals Specialist today!
Buka akaun dagangan patuh syariah anda di Weltrade.
Source link