After running the largest monthly surplus ever in April, the Treasury was back to running deficits in May. The Federal government spent $455B in May and collected $389B in taxes, which resulted in a net deficit of $66B.

Figure: 1 Monthly Federal Budget
Looking historically, this is the smallest May budget deficit since May 2016. As shown below, spending eclipsed all years before 2020, but revenues were also extremely elevated. This has been a major theme for the Treasury for the last 18 months. Tax revenues have blasted to all-time highs.
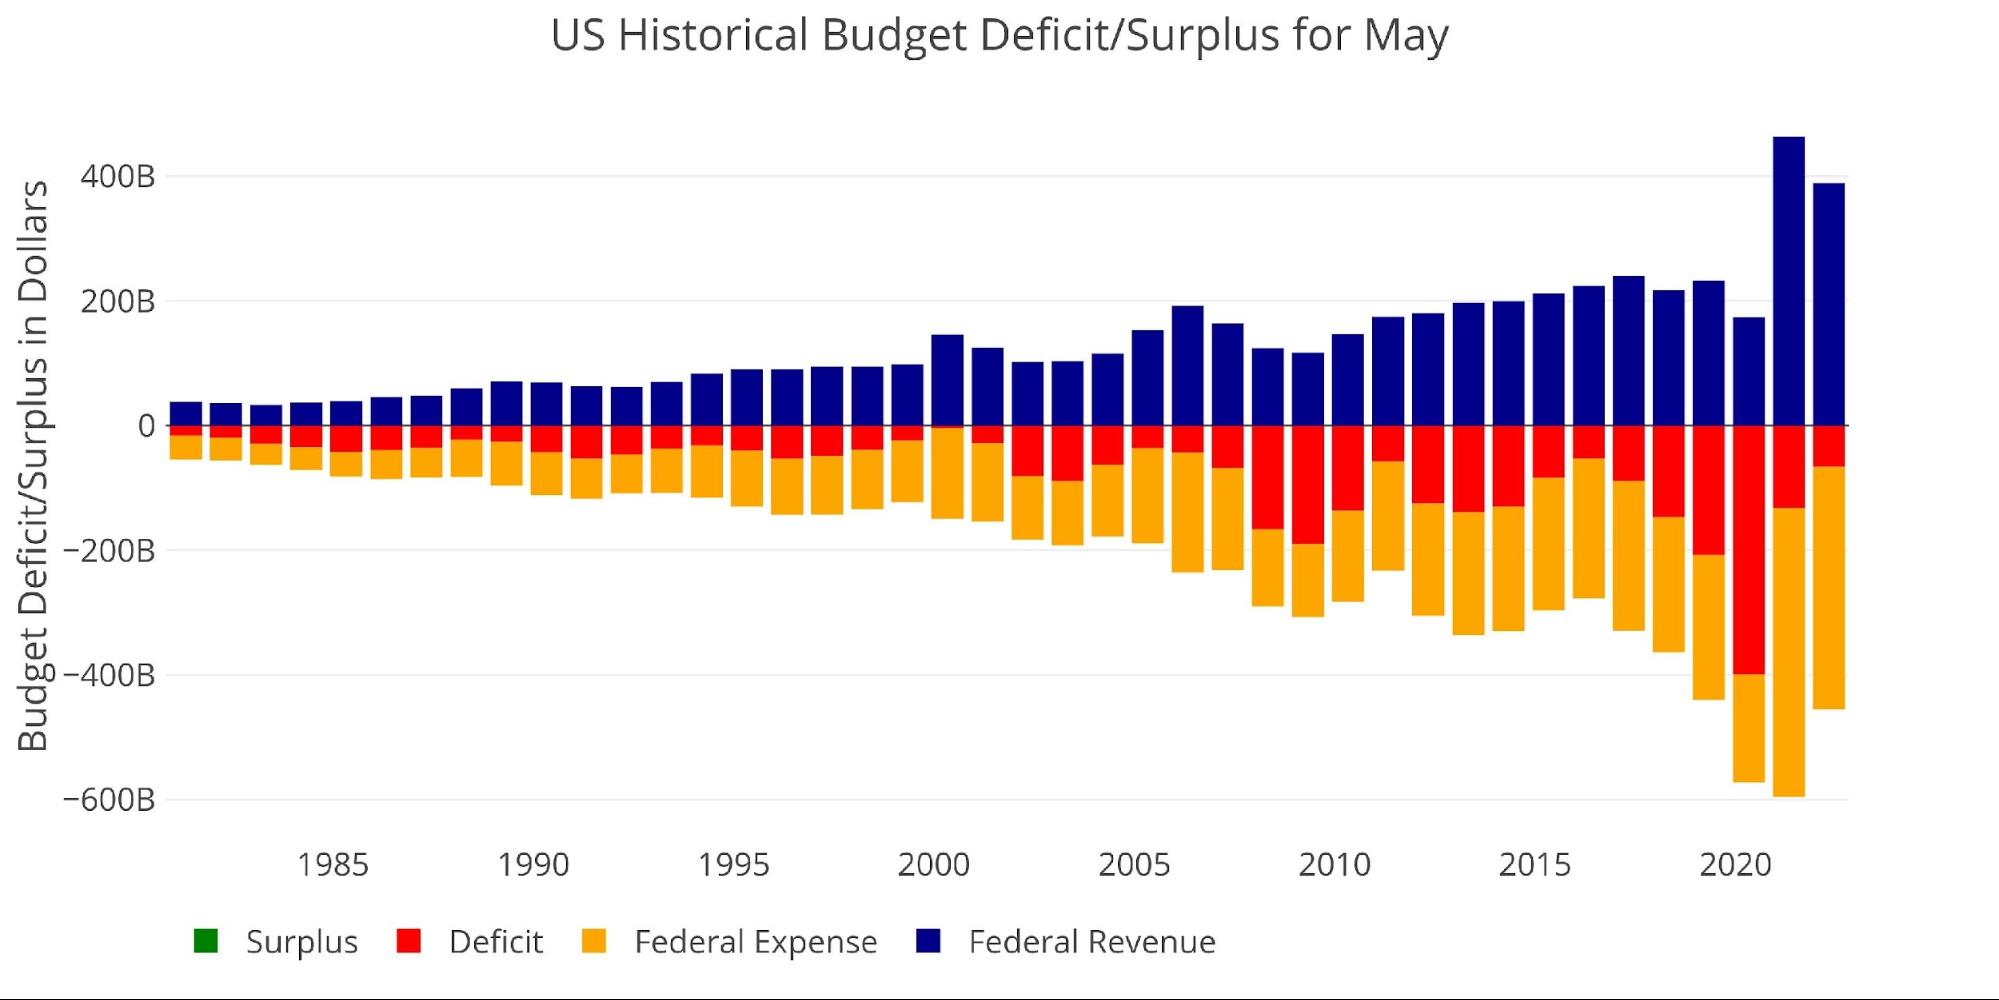
Figure: 2 Historical Deficit/Surplus for May
A recent report by the CBO highlights the surge in tax revenues:
“About one-third of this year’s jump in individual income tax receipts results from growth in the economy … In CBO’s estimation, another one-third of the growth in receipts in 2022 results from the end of temporary provisions enacted in response to the pandemic. One of those provisions allowed employers to defer payment of a portion of certain payroll taxes in 2020 and 2021. The payment of half of those deferred taxes, combined with the end of other temporary provisions, has boosted receipts in 2022. … The remaining growth in individual income taxes this year cannot yet be explained. Tax collections in both 2020 and 2021 were larger than the currently available data on economic activity would suggest.”
An article by Politico also highlights the impact of inflation. As wages rise, tax brackets do not rise as quickly which pushes people into higher tax brackets.
Surprisingly, not even the CBO can explain a large portion of the tax revenue surge. The CBO also recognizes this surge is unlikely to last in the short-term but should return after 2025 when Trump tax cuts expire:
“Individual income tax receipts are projected to decline as a share of GDP over the next few years because of the expected dissipation of some of the factors that caused their recent surge. For example, realizations of capital gains (profits from selling assets that have appreciated) are projected to decline from the high levels of the past two years to a more typical level relative to GDP. Subsequently, from 2025 to 2027, individual income tax receipts are projected to rise sharply because of changes to tax rules set to occur at the end of calendar year 2025. After 2027, those receipts remain at or slightly below the 2027 level relative to GDP.”
Getting back into the data, the next chart shows the 10-year historical average of each month’s Deficit/Surplus and compares this number to the most recent month (e.g., May 2022 compared to the previous 10-year average). The year from April 2020-March 2021 is removed because that was during the brunt of the Covid crisis and stimulus packages, skewing the averages.
As shown, the current May deficit is almost half the 10-year average of $122B.

Figure: 3 Current vs Historical
The Sankey diagram below shows the distribution of spending and revenue. The Deficit represented 14.5% of spending in the most recent month, but this is still below the TTM, where the Deficit represented 19% of total spending (Figure 5).
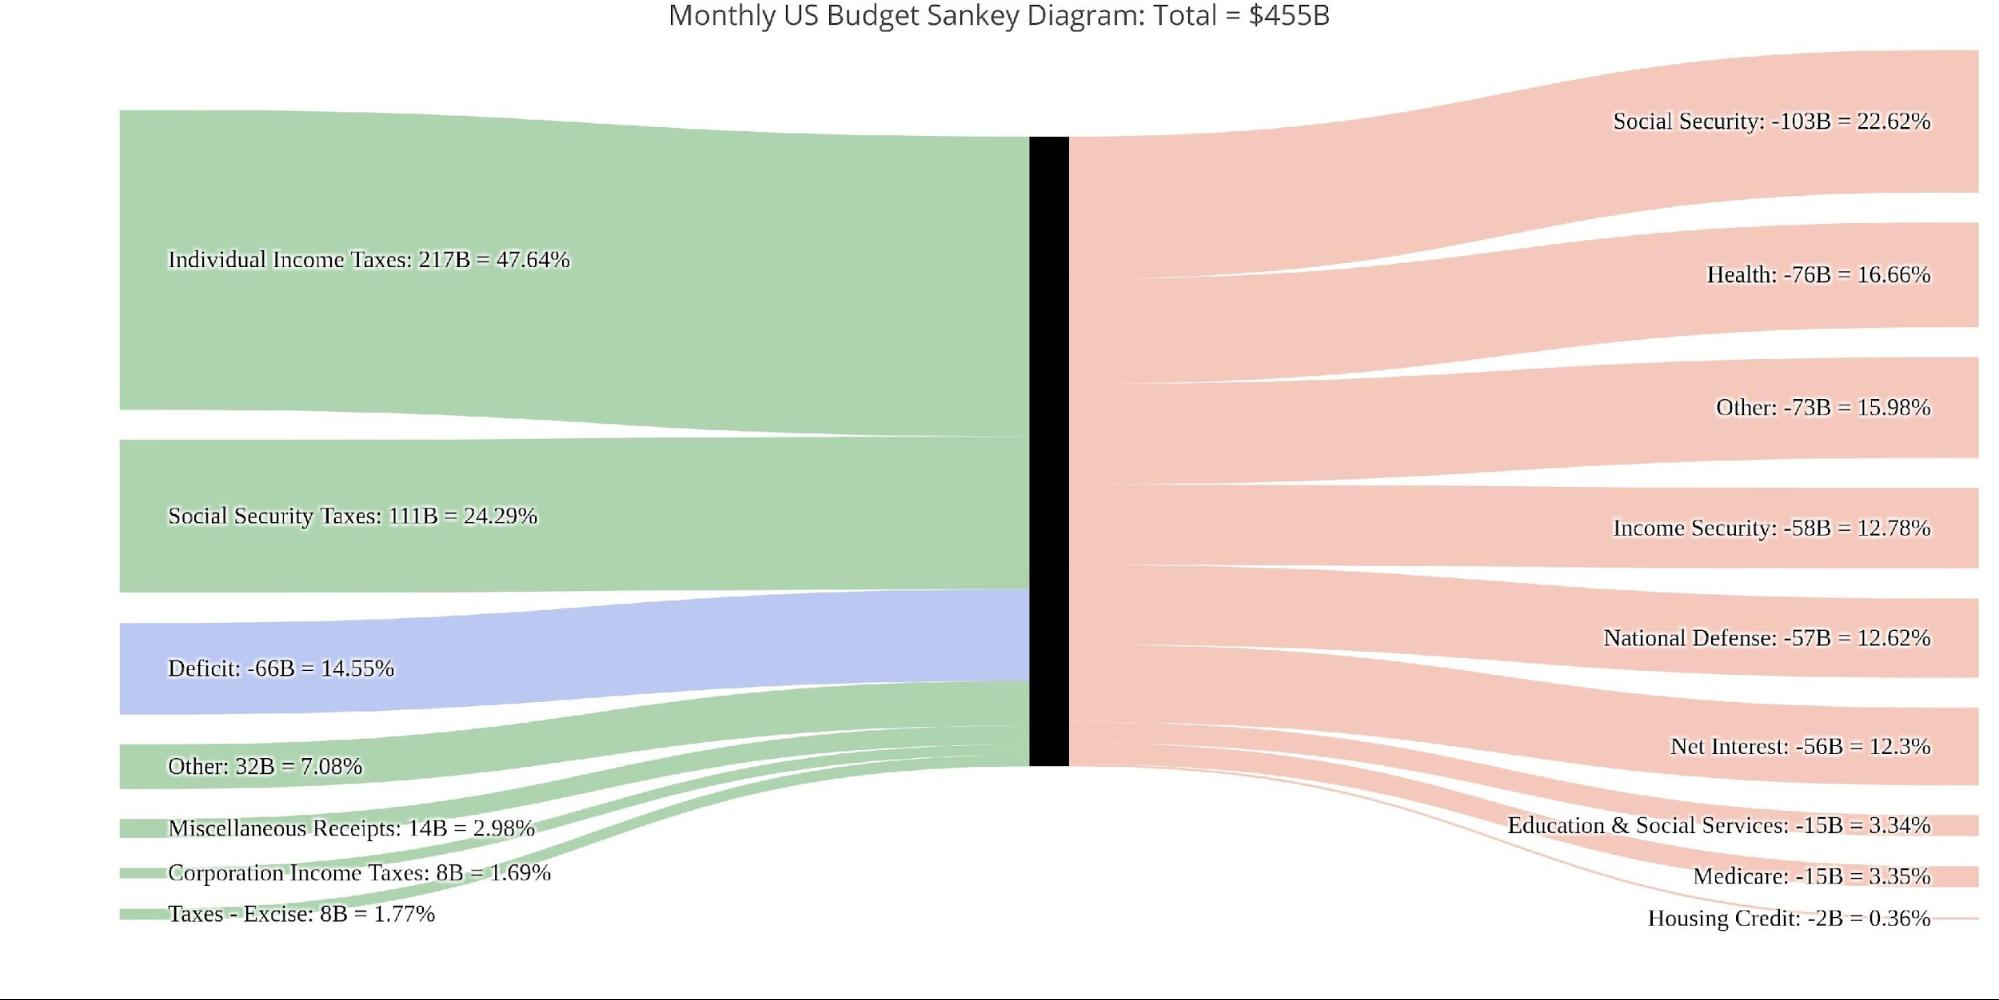
Figure: 4 Monthly Federal Budget Sankey
Despite the somewhat smaller Deficit, it’s clear that the government still has a major spending problem that will not be easy to fix. The annual diagram below shows how the spending is spread across multiple categories, many of which are too political to expect any reduction.

Figure: 5 TTM Federal Budget Sankey
The Treasury does not provide detail on revenue beyond the high-level categories. Individual Tax Revenues have been the biggest drivers. May revenues were below December, January, and the massive figure in April, but were above February and March.
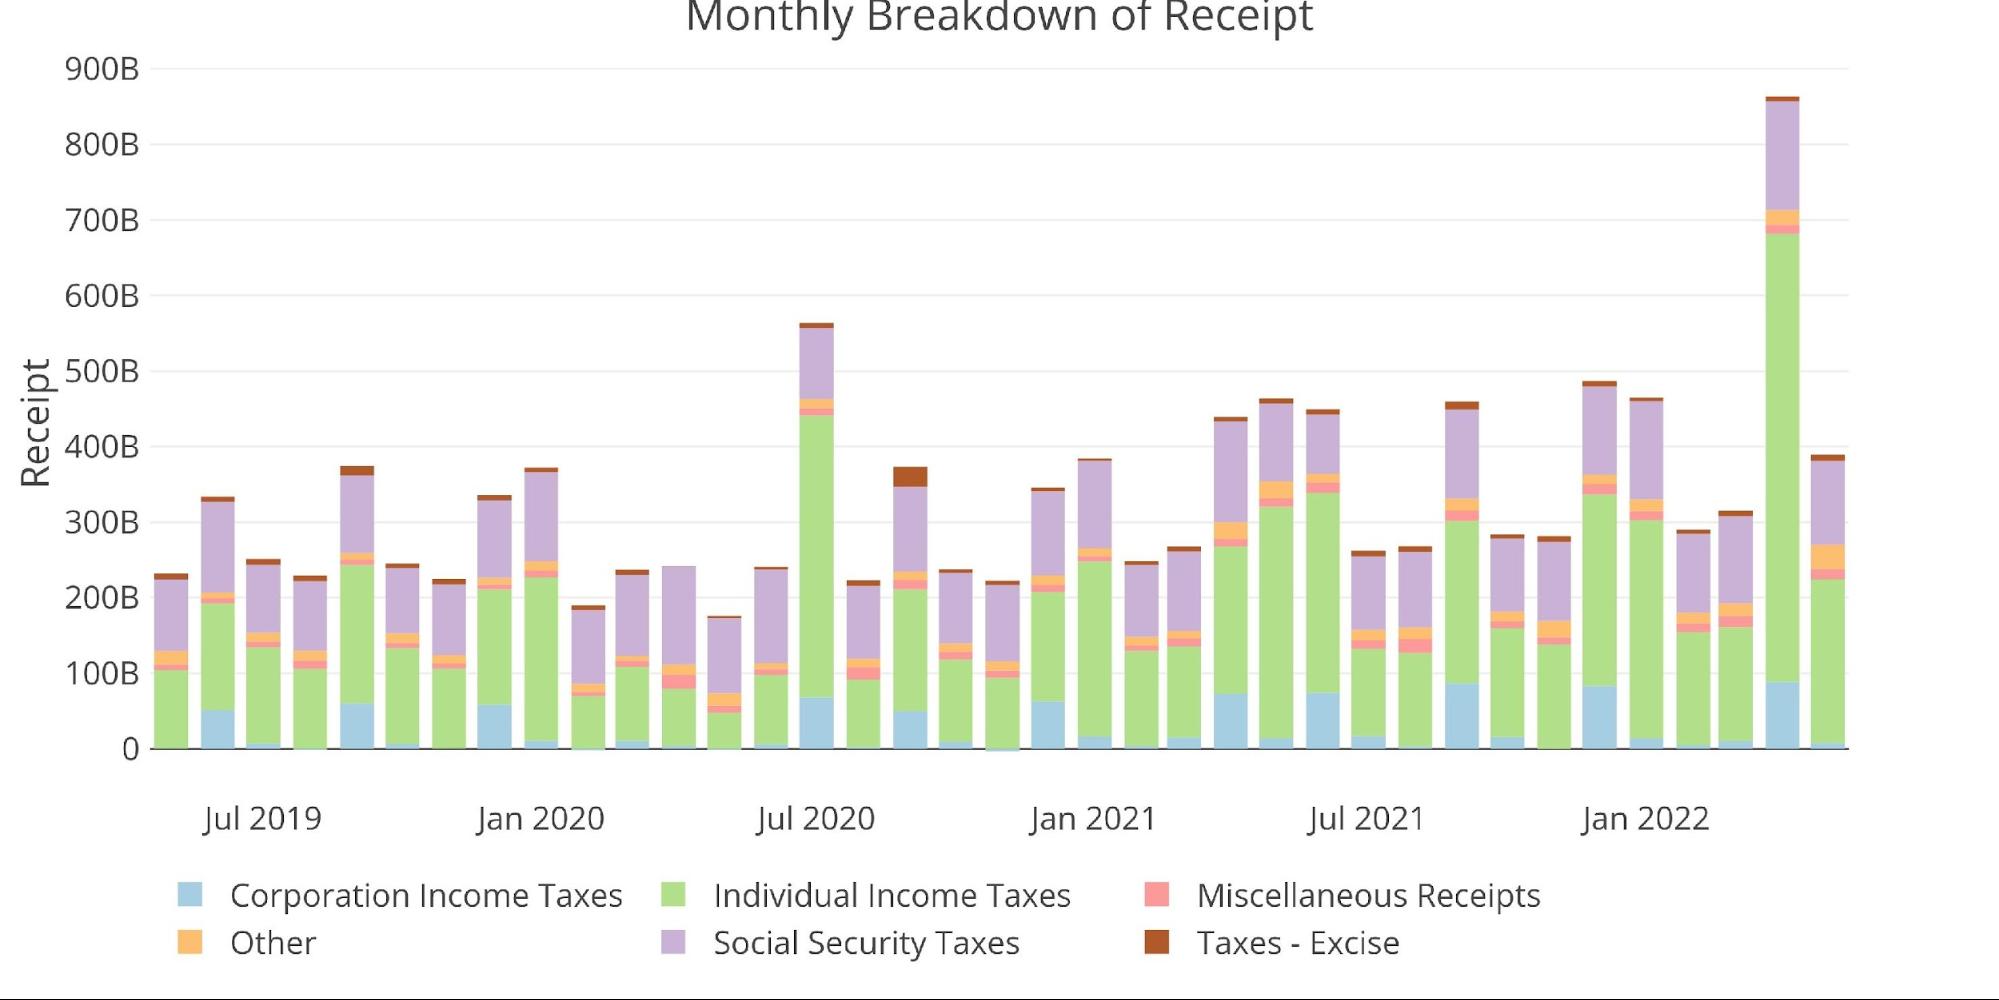
Figure: 6 Monthly Receipts
The Expense side saw a dip when compared to many of the recent months. This was due to a drop in both Medicare and Income Security.
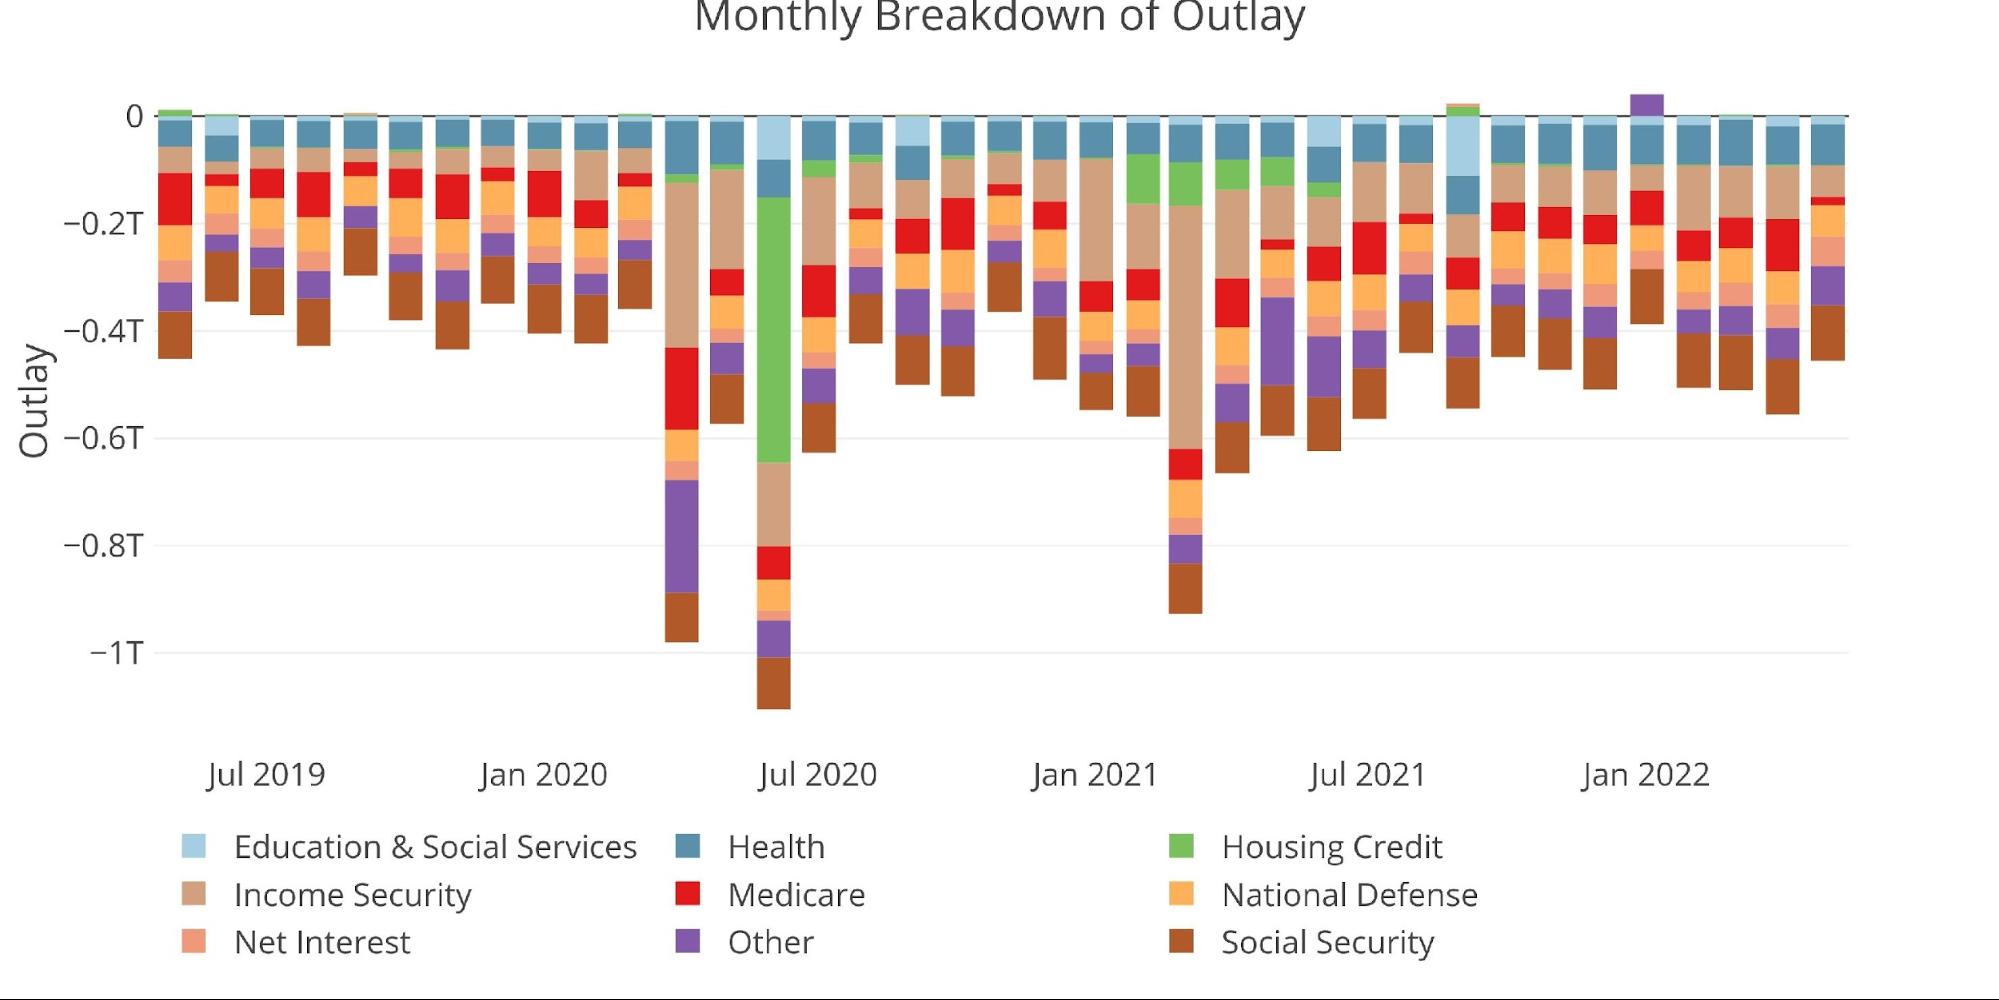
Figure: 7 Monthly Outlays
The table below goes deeper into the numbers of each category. The key takeaways from the charts and table:
Outlays
- Debt Interest is up 30% on a TTM basis
- Housing Credit has dropped 97% as stimulus ended a year ago
Receipts
- TTM Individual Taxes are up 83% compared to TTM ending April 2020!
- Corporate Taxes are up almost 100% from TTM ending April 2020
Total
- The Total Deficit remains above $1T, but is down significantly from the Covid years
As the Economy hurtles towards stagflation, the Federal government will be inclined to increase spending again as it tries to devise a “rescue” package. Revenues will likely fall in such an event, which will exacerbate the problem.
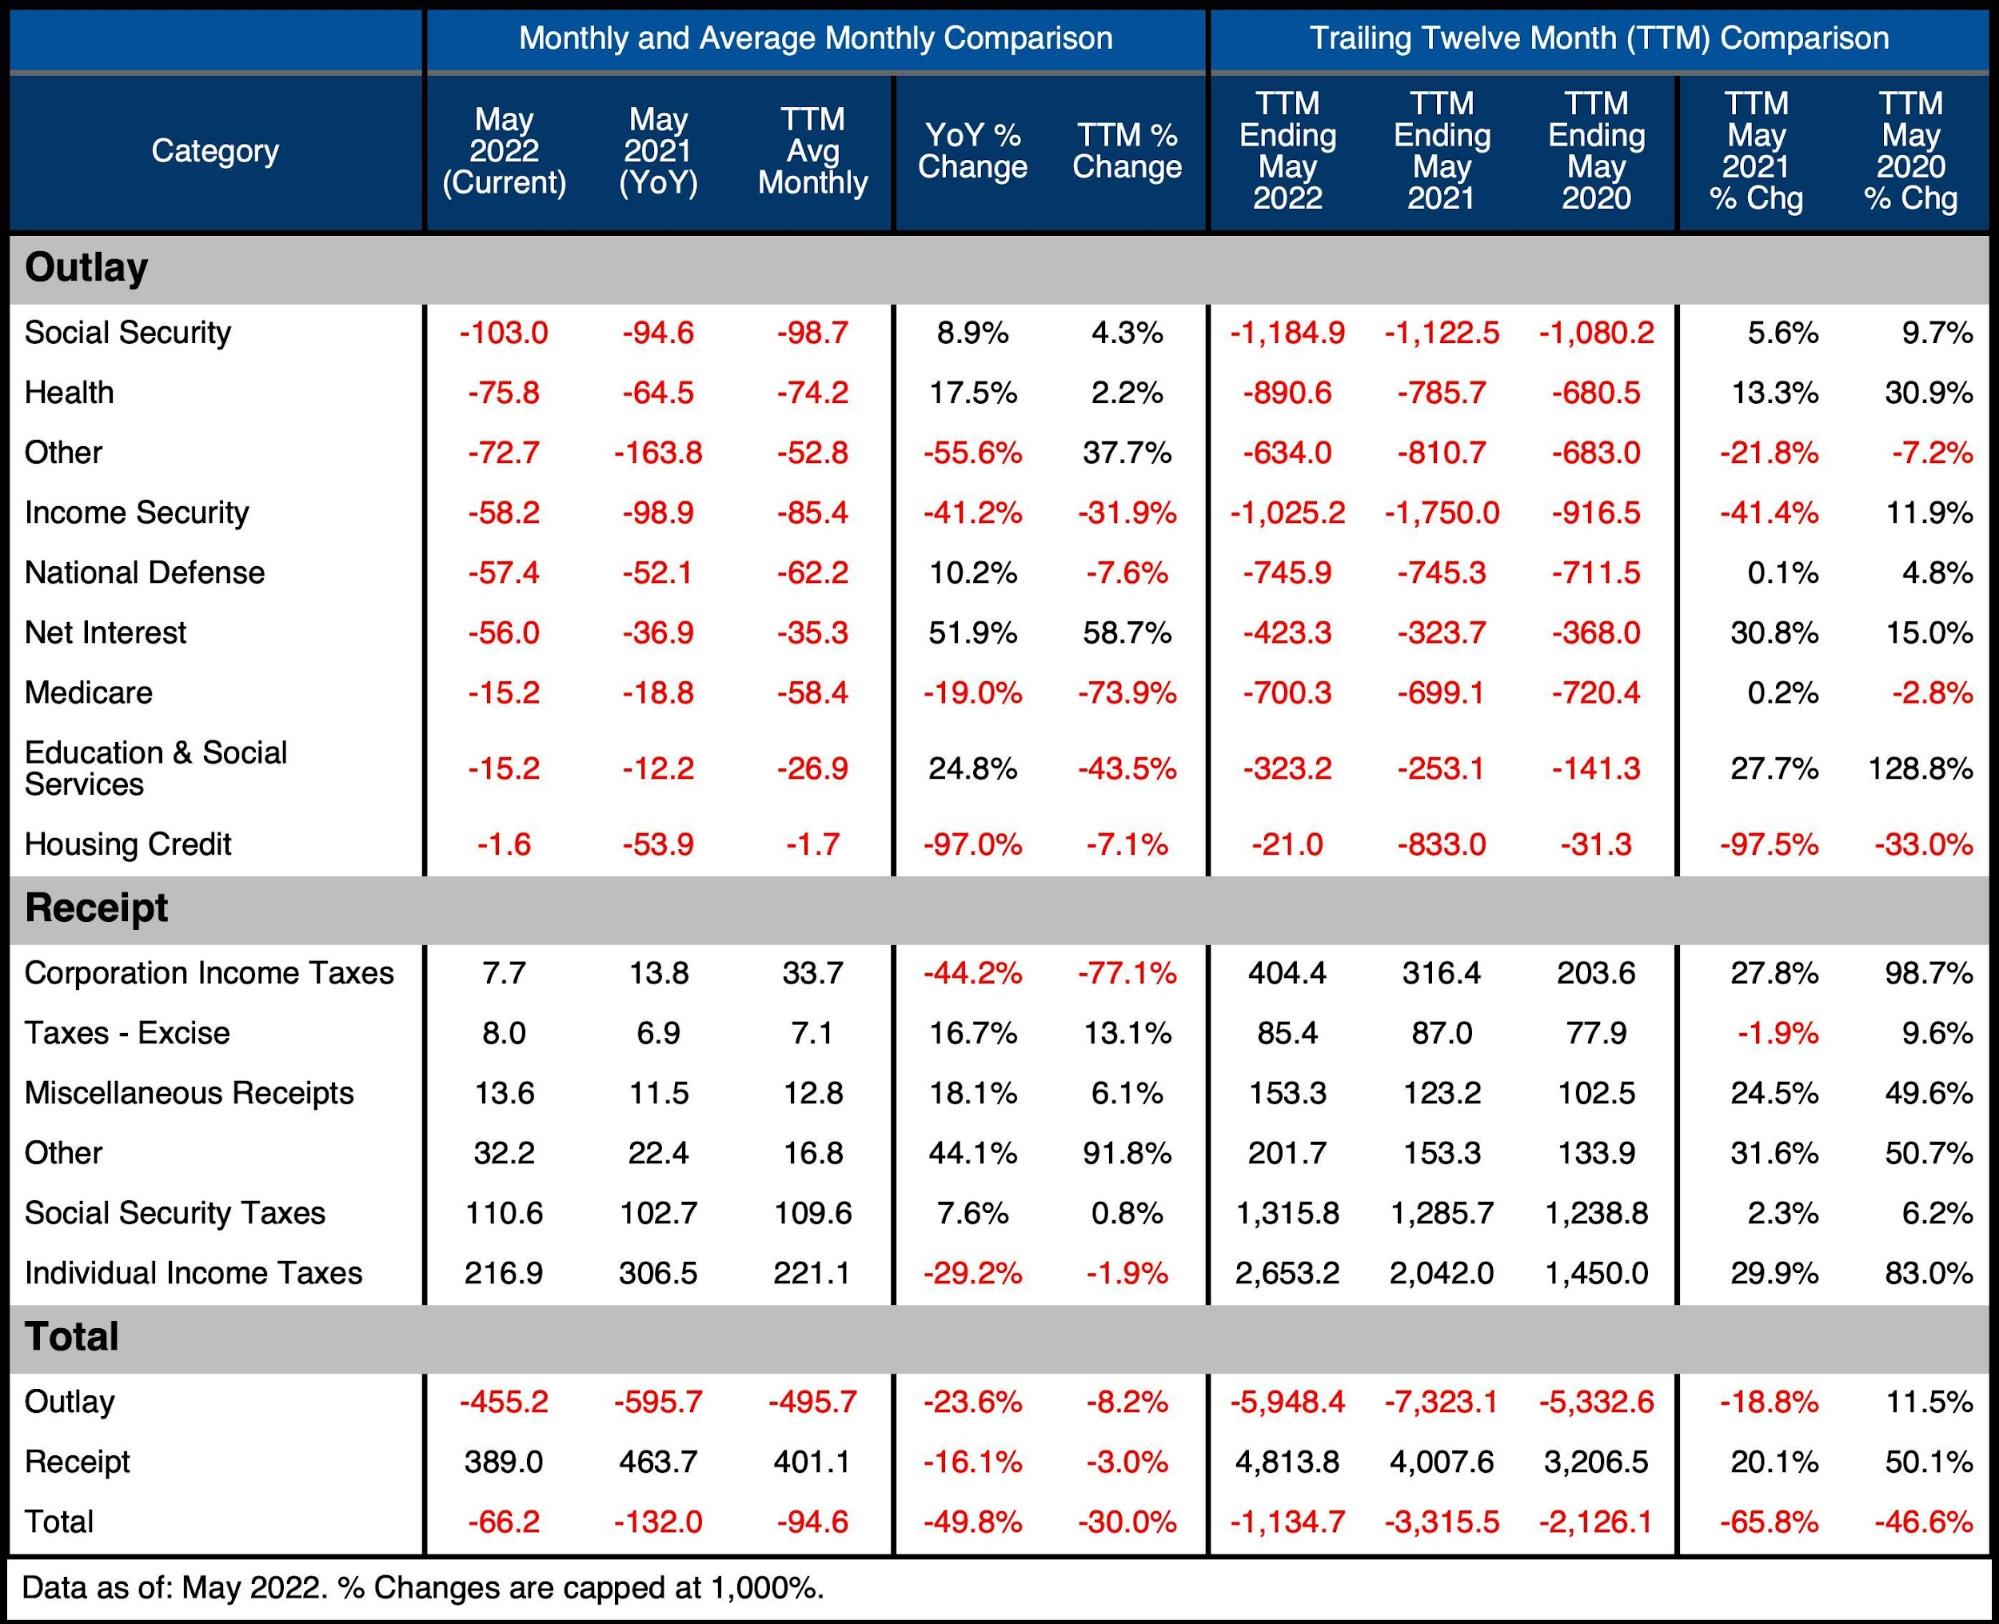
Figure: 8 US Budget Detail
Historical Perspective
Zooming out and looking over the history of the budget back to 1980 shows a complete picture and just how extreme the last two years have been. The chart below shows the data on a TTM basis to smooth out the lines.
As can be seen, Expenses have fallen recently and Tax Revenues have surged. That being said, spending is well above pre-pandemic levels. If the tax revenue windfall dries up, it will be very problematic for the Treasury.
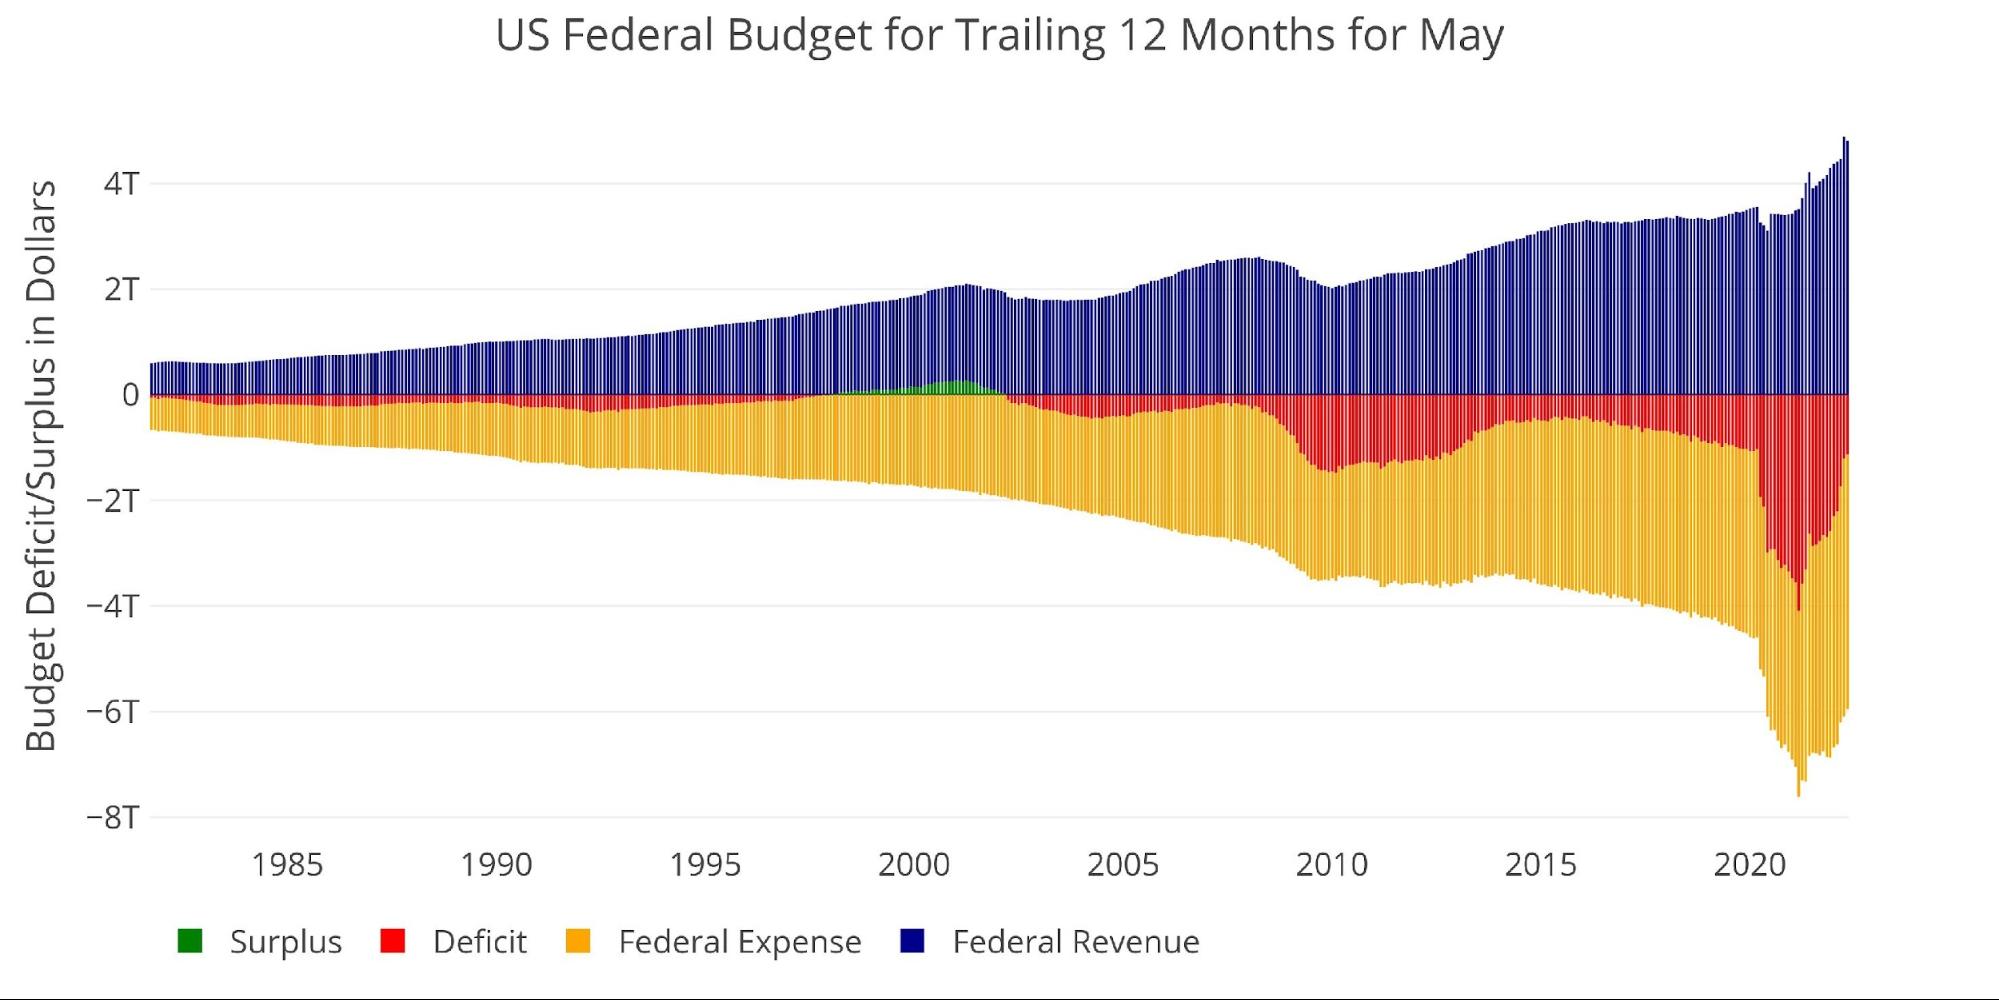
Figure: 9 Trailing 12 Months (TTM)
The next two charts zoom in on the recent periods to show the change when compared to pre-Covid. The current 12-month period is more than $1.5T bigger than pre-Covid levels of 2019.
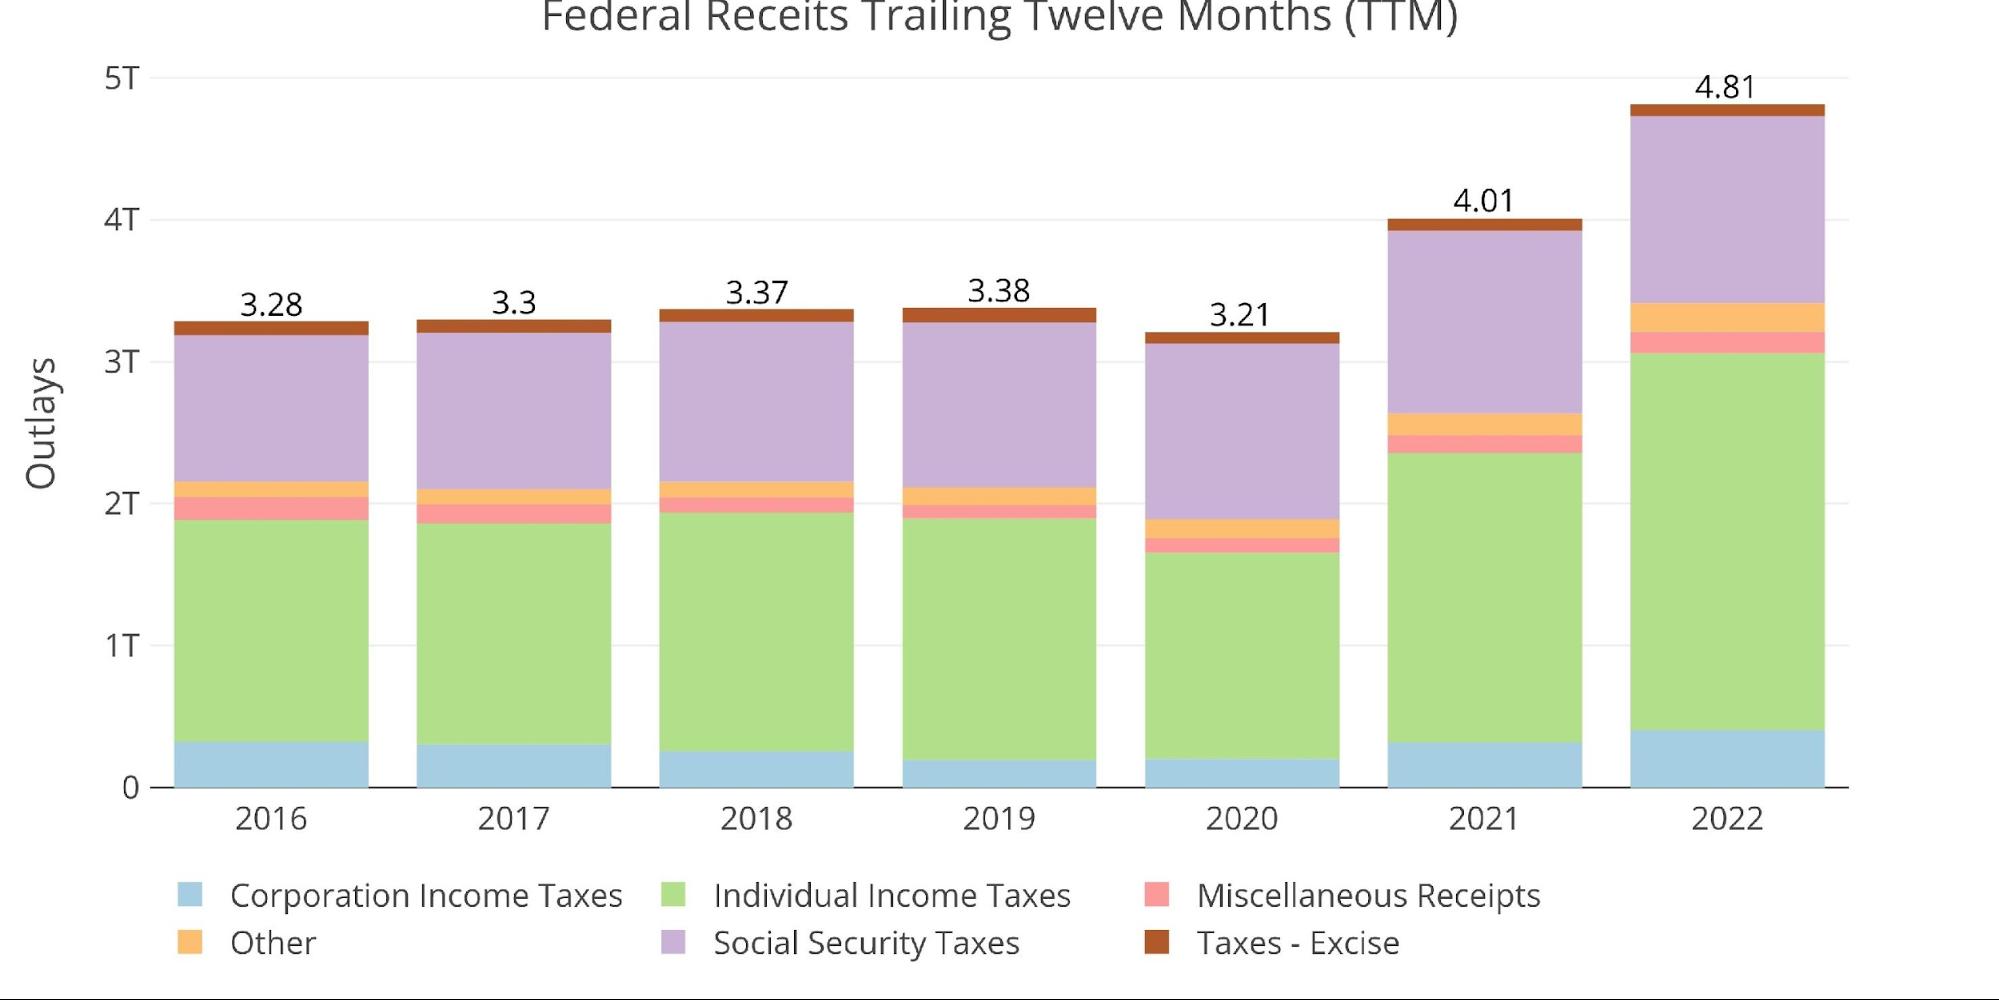
Figure: 10 Annual Federal Receipts
As mentioned previously though, Outlays remain very elevated. Current TTM is $1.6T larger than the same TTM in 2019.
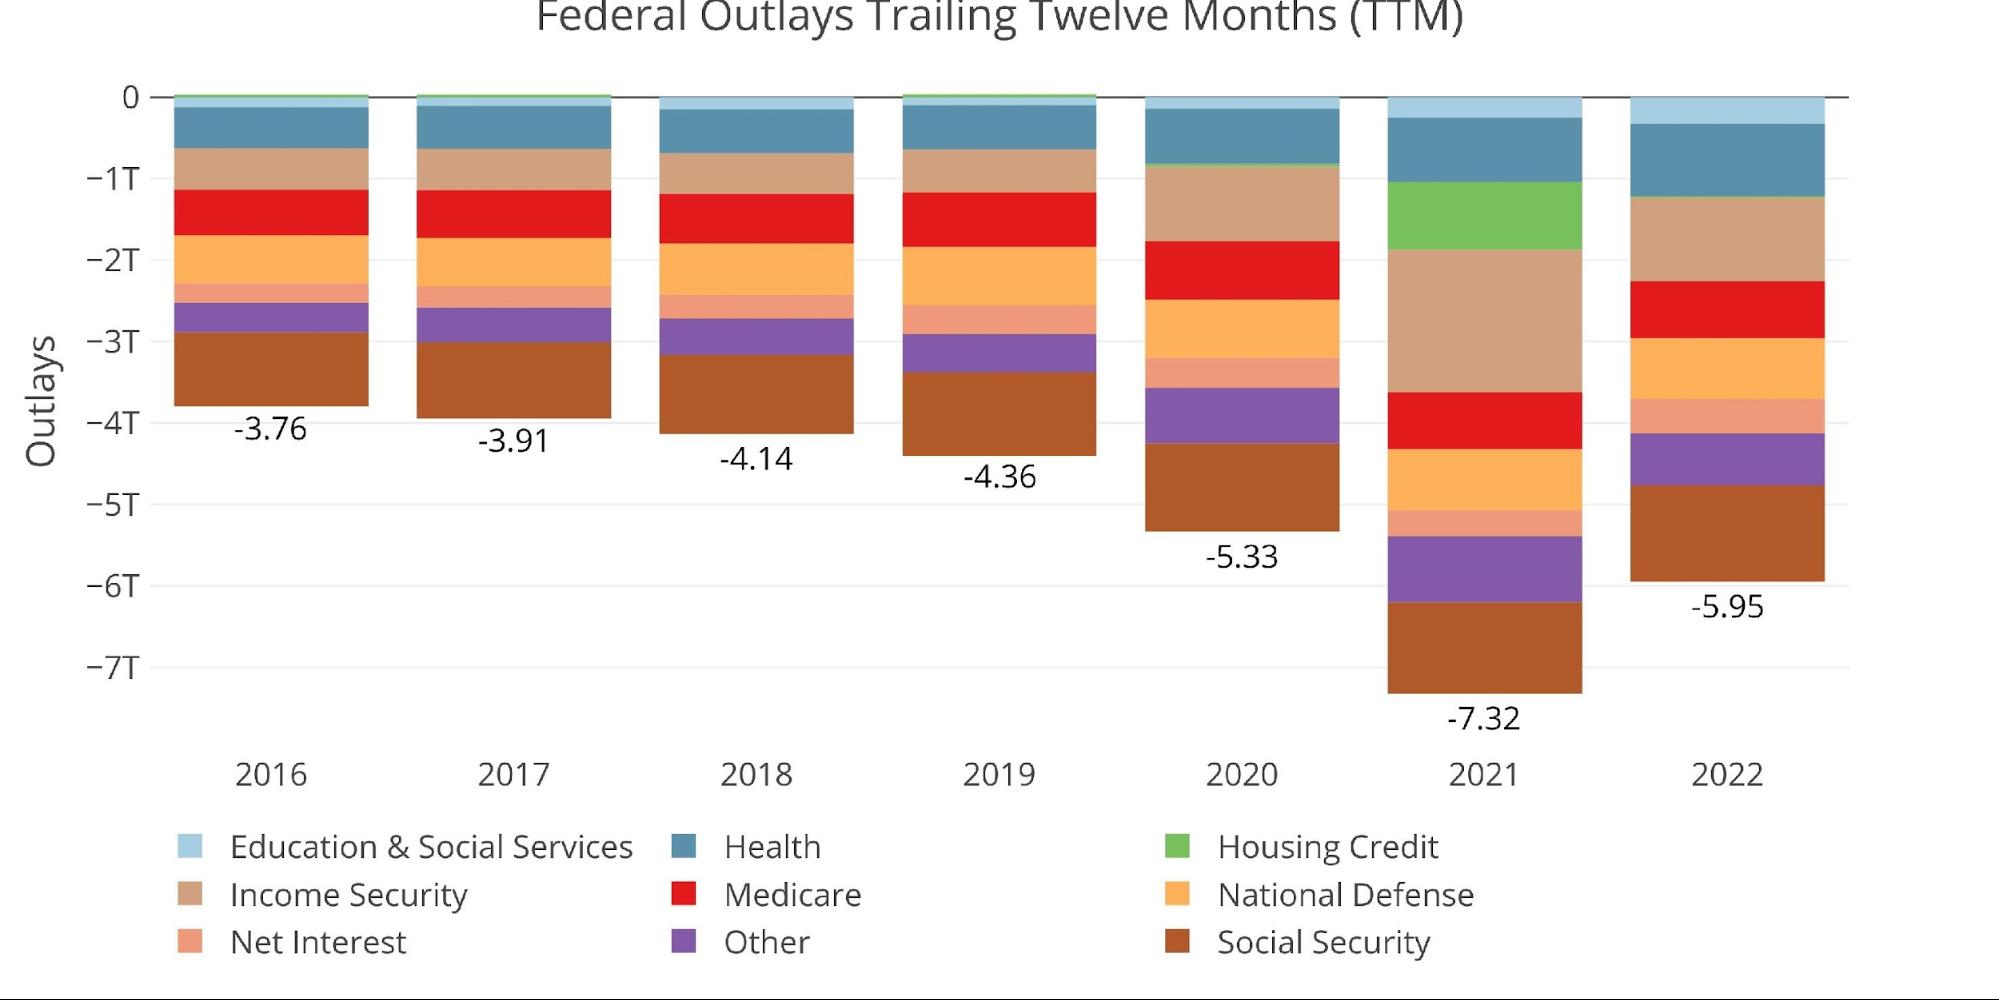
Figure: 11 Annual Federal Expenses
Due to the changing dynamics, TTM Deficit compared to GDP has returned to pre-Covid levels of 4.7%.
Note: GDP Axis is set to log scale

Figure: 12 TTM vs GDP
Finally, to compare the calendar year with previous calendar years, the plot below shows the YTD figures through May. The Treasury is running its smallest Deficit since 2001.
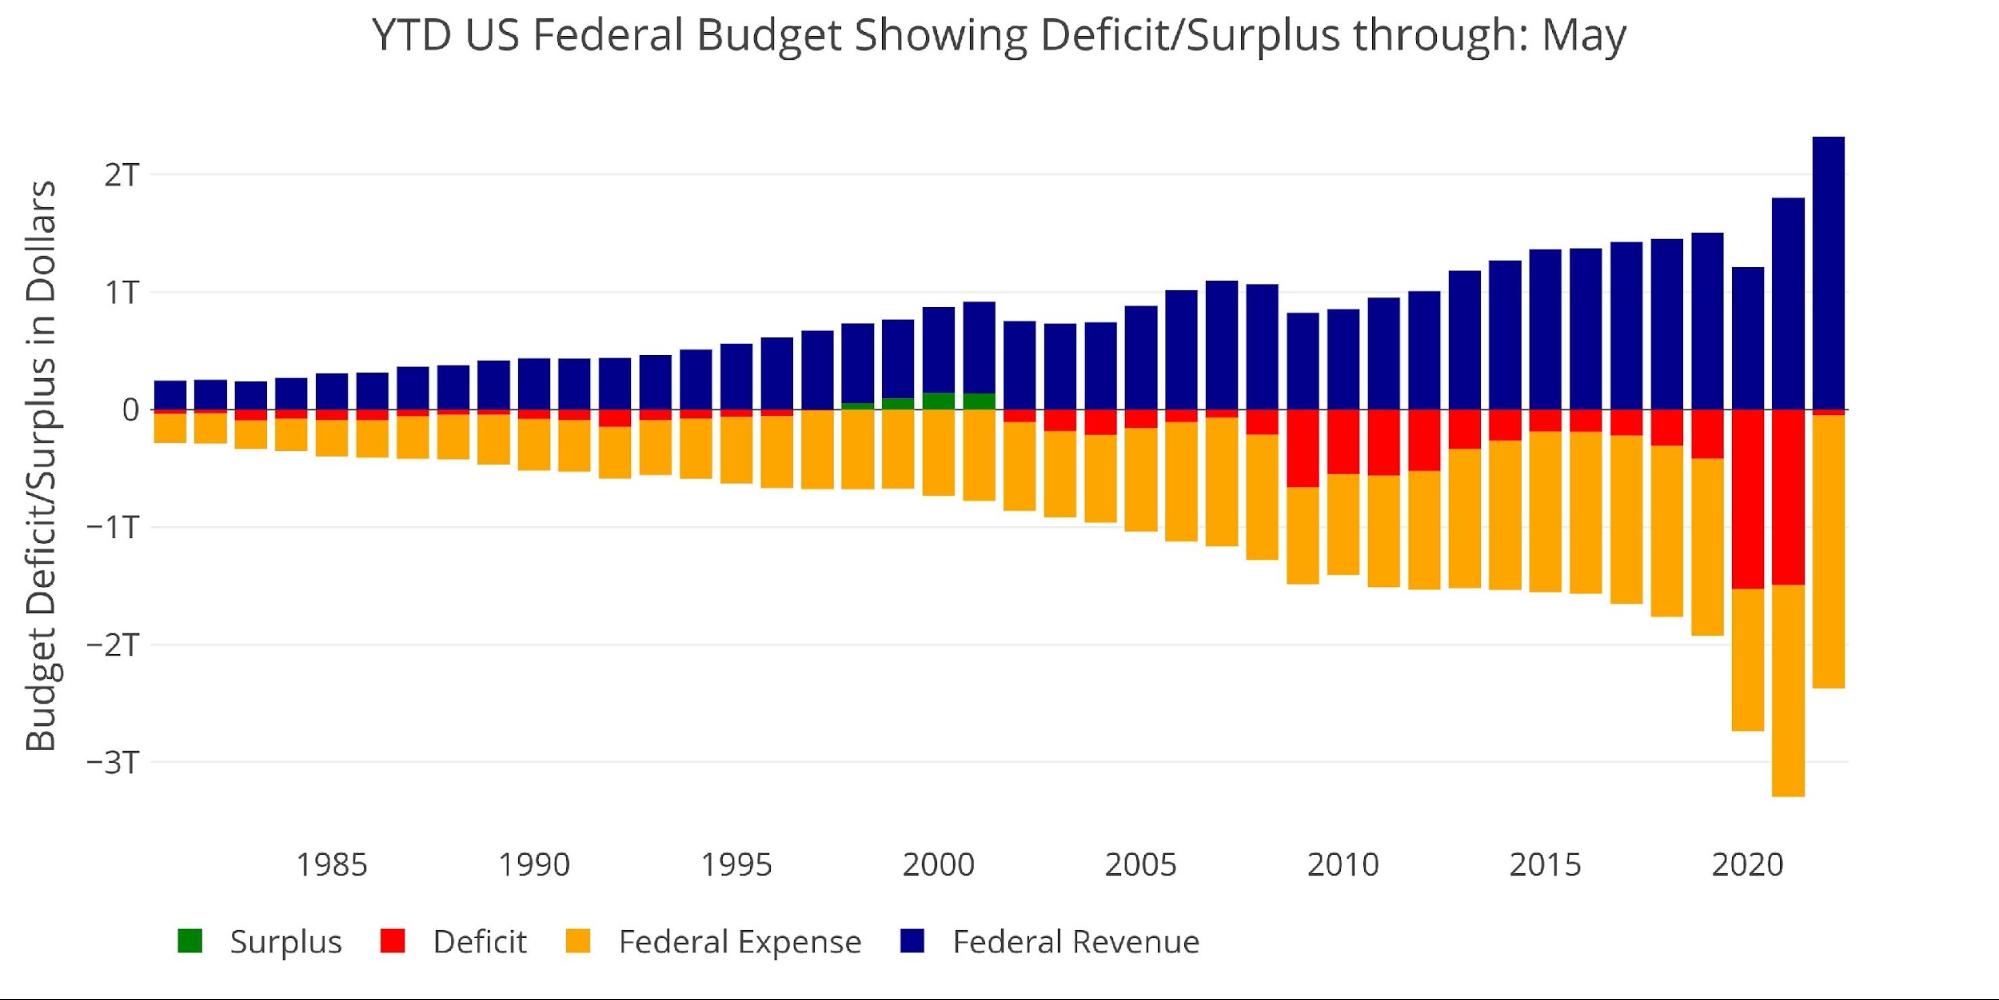
Figure: 13 Year to Date
What it means for Gold and Silver
The Treasury is certainly reaping major benefits from the massive surge in tax revenues. This has it on track to “only” run a Fiscal Deficit of $1T compared to the $2T-$3T over the last two years. It should be emphasized that $1T is still a massive deficit.
The problem is the CBO does not expect the surge in Revenue to last beyond what can be attributed to economic growth (really just inflation). Spending does not look poised to fall, especially with a major recession looming. The government is most likely enjoying a reprieve before Deficits explode higher once more.
When this happens, the Fed will have to step in to keep interest rates from creating a massive debt spiral at the Treasury. When this happens, the dollar will fall hard with gold and silver rising. Physical metal will be the best insurance against such a scenario.
Data Source: Monthly Treasury Statement
Data Updated: Monthly on the eighth business day
Last Updated: Period ending May 2022
US Debt interactive charts and graphs can always be found on the Exploring Finance dashboard: https://exploringfinance.shinyapps.io/USDebt/

Call 1-888-GOLD-160 and speak with a Precious Metals Specialist today!
Buka akaun dagangan patuh syariah anda di Weltrade.
Source link