
Gold: Recent Delivery Month
Gold has seen the largest delivery volume in 2022 with 33,593 contracts delivered so far and 244 remaining in open interest. Since 2020, only December and February last year recorded larger volumes.
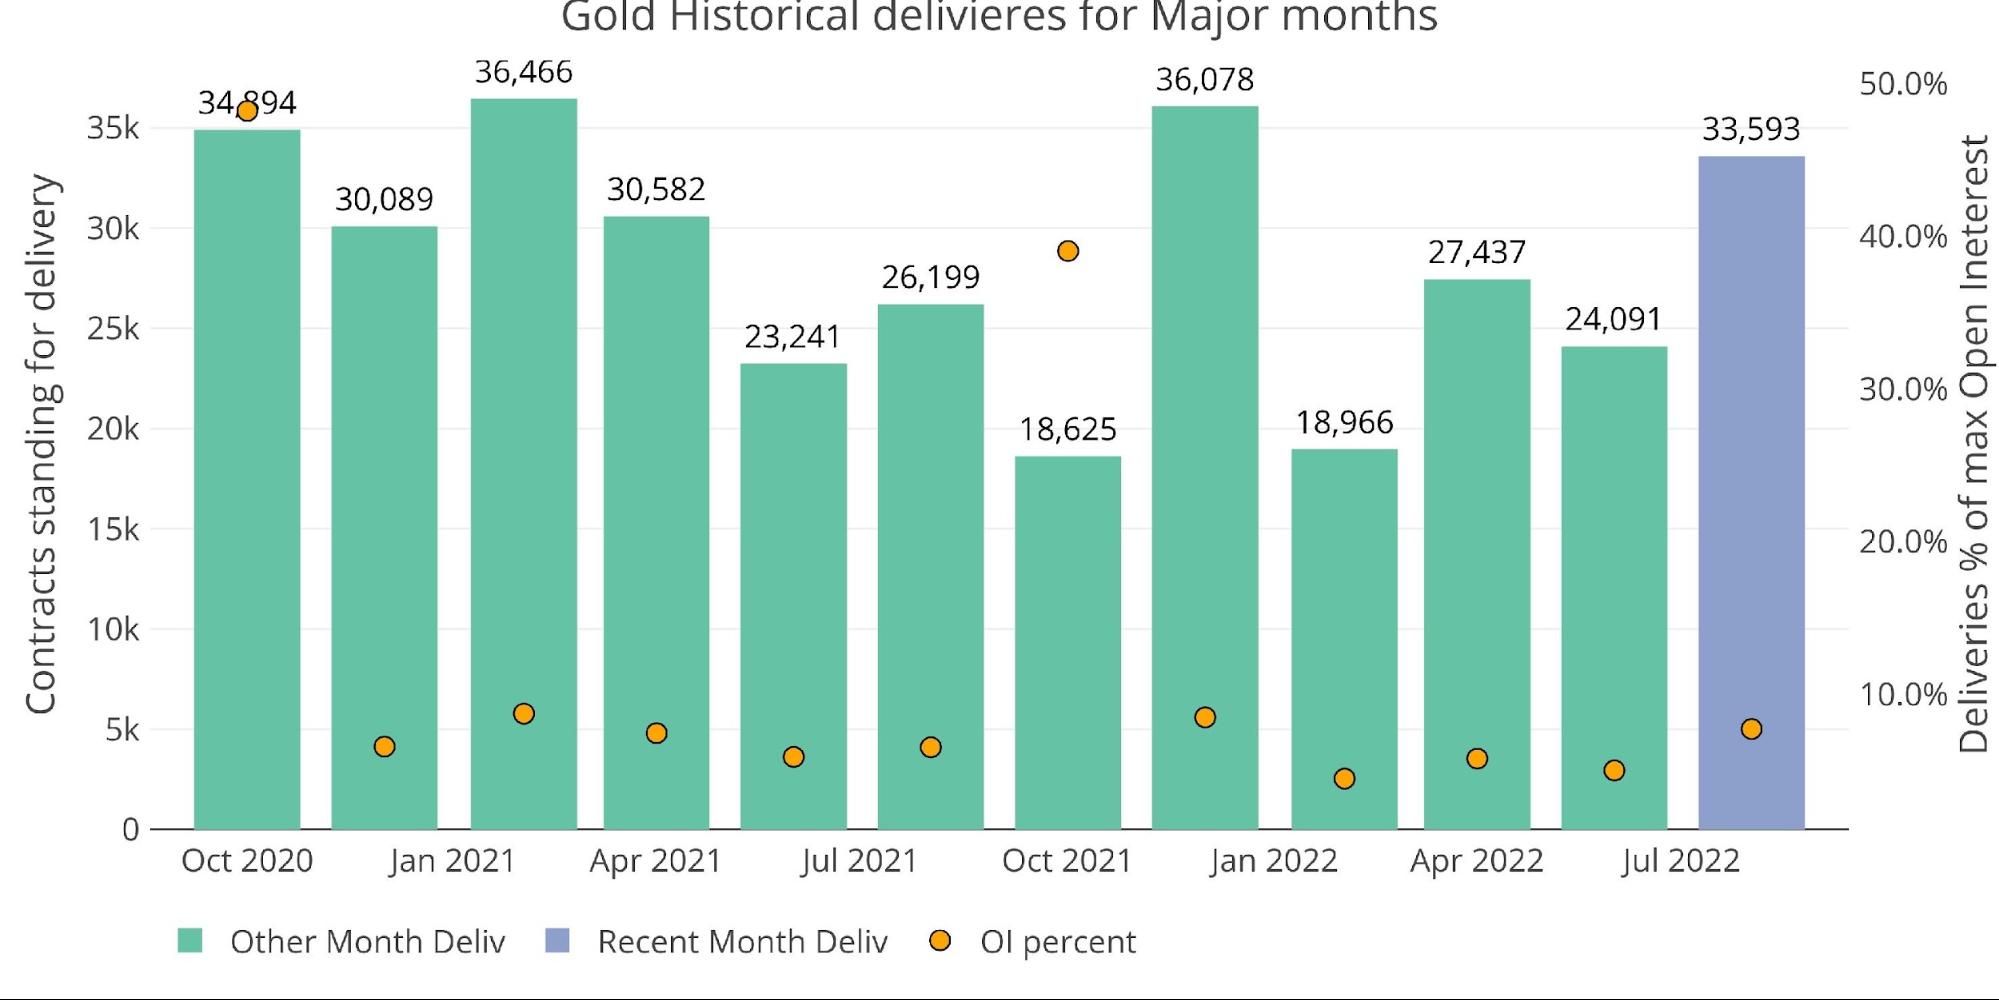
Figure: 1 Recent like-month delivery volume
Unlike past months, the large volume was not really driven by mid-month net new contracts. Activity was well below recent months with only 1,935 contracts opened for immediate delivery. It should be noted that this figure was negative up to 8 days past first notice so there was definitely still strength mid-month.
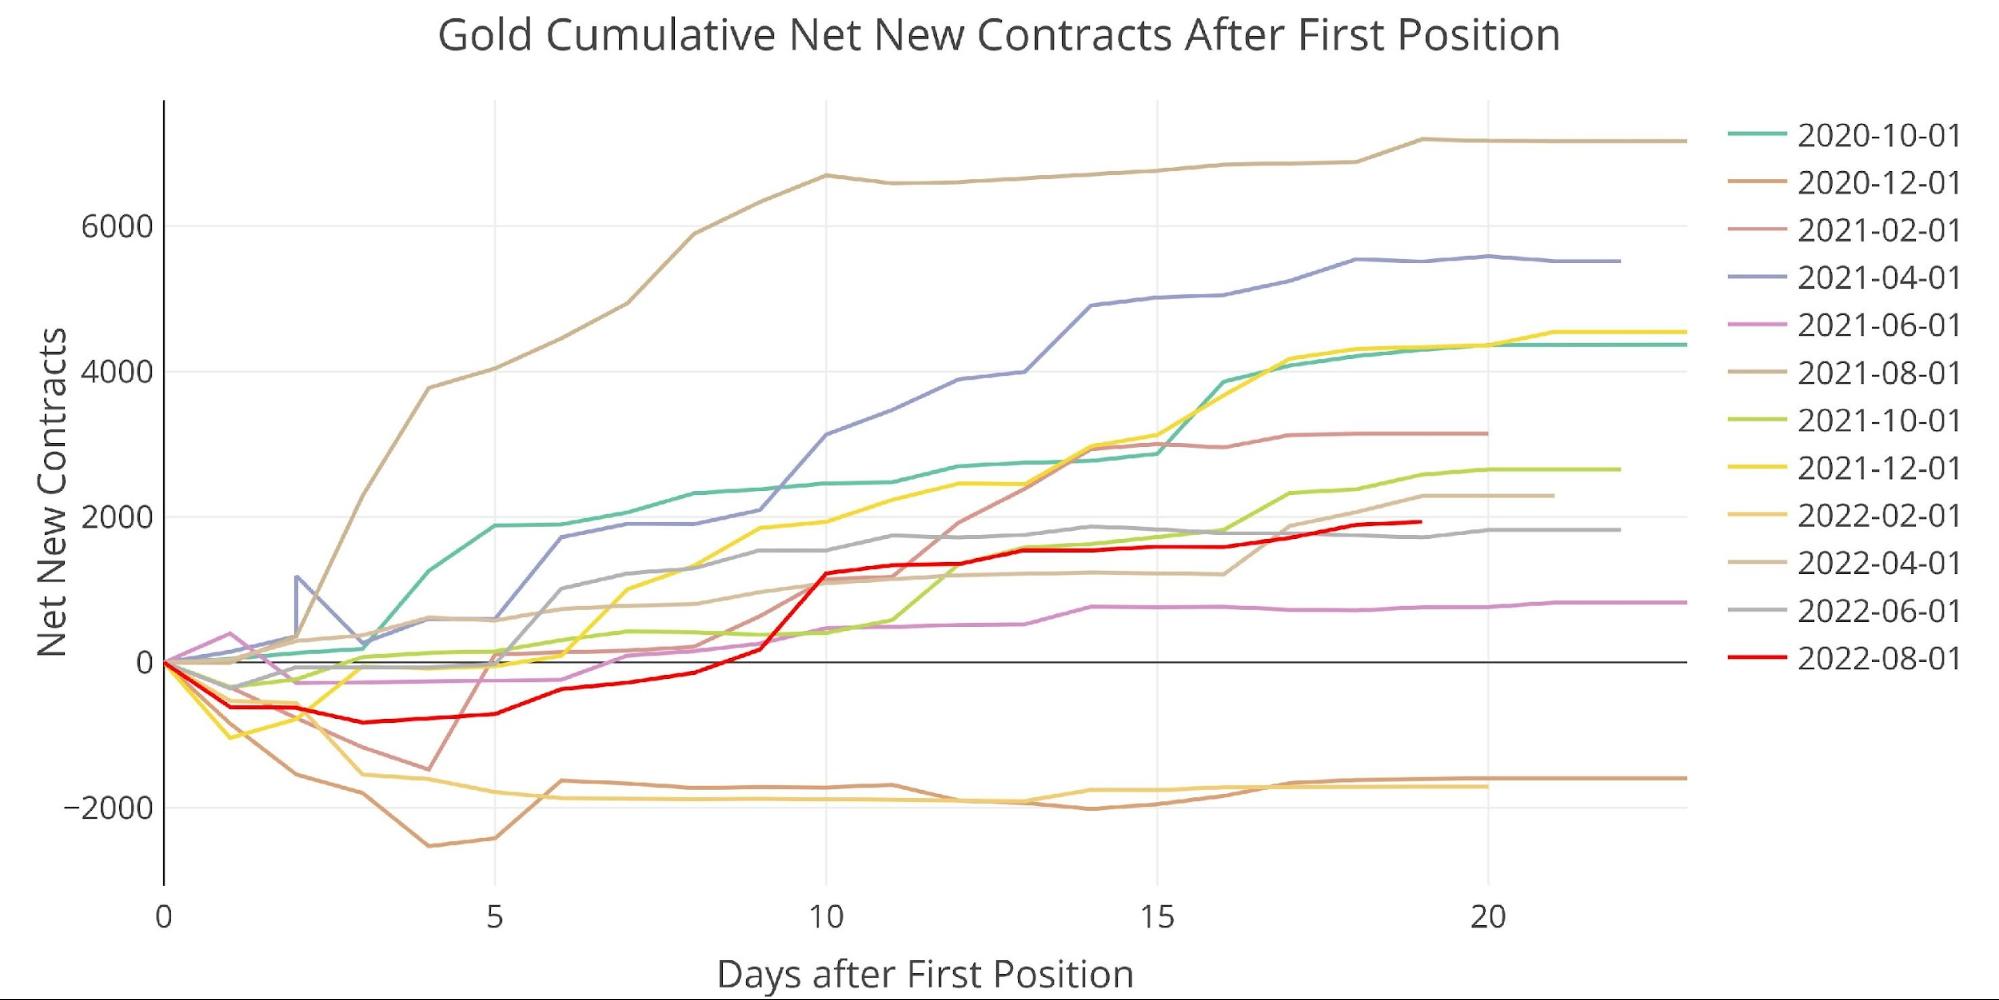
Figure: 2 Cumulative Net New Contracts
From a dollar volume perspective, this month was more than $1.1B larger than last August but still well below the records from summer 2020.

Figure: 3 Notional Deliveries
Another major event this month was the record net delivery of contracts from the banks. The previous record was set in April in the wake of the Ukraine/Russia conflict. This month is nearly 30% higher with 8,340 contracts in net delivery volume. BofA is still a big player as they buy back about half of the metal they delivered out last month.

Figure: 4 House Account Activity
It’s very possible that banks are becoming more active as their inventory dwindles. As noted in the stock report, gold has been leaving Comex vaults at an unprecedented pace. While the last few days have seen inflows into Eligible, the removal from Registered is striking. Since May 1st, 4.17M ounces have left Registered. Nearly 13% of that occurred in the last two days alone as 540k ounces left (see below).

Figure: 5 Recent Monthly Stock Change
Gold: Next Delivery Month
Jumping ahead to September shows elevated open interest. It is currently below both March and May of this year, but those months showed exceptionally high open interest at this point in the contract. Furthermore, both March and May were influenced by the conflict in Ukraine. The elevated open interest this month does not (yet) have a clear driver.

Figure: 6 Open Interest Countdown
The chart below shows deliveries for the last several minor months. Delivery volume has been quite elevated. The action in minor months can be heavily influenced by mid-month activity. Thus, regardless of the open interest at First Notice next week, it will be a few weeks before the full delivery volume will be known.

Figure: 7 Historical Deliveries
Spreads
Jumping out to the October contract shows the market in strong Contango, higher even than the August contract at a similar point. The current spread between October and December is nearly $10.
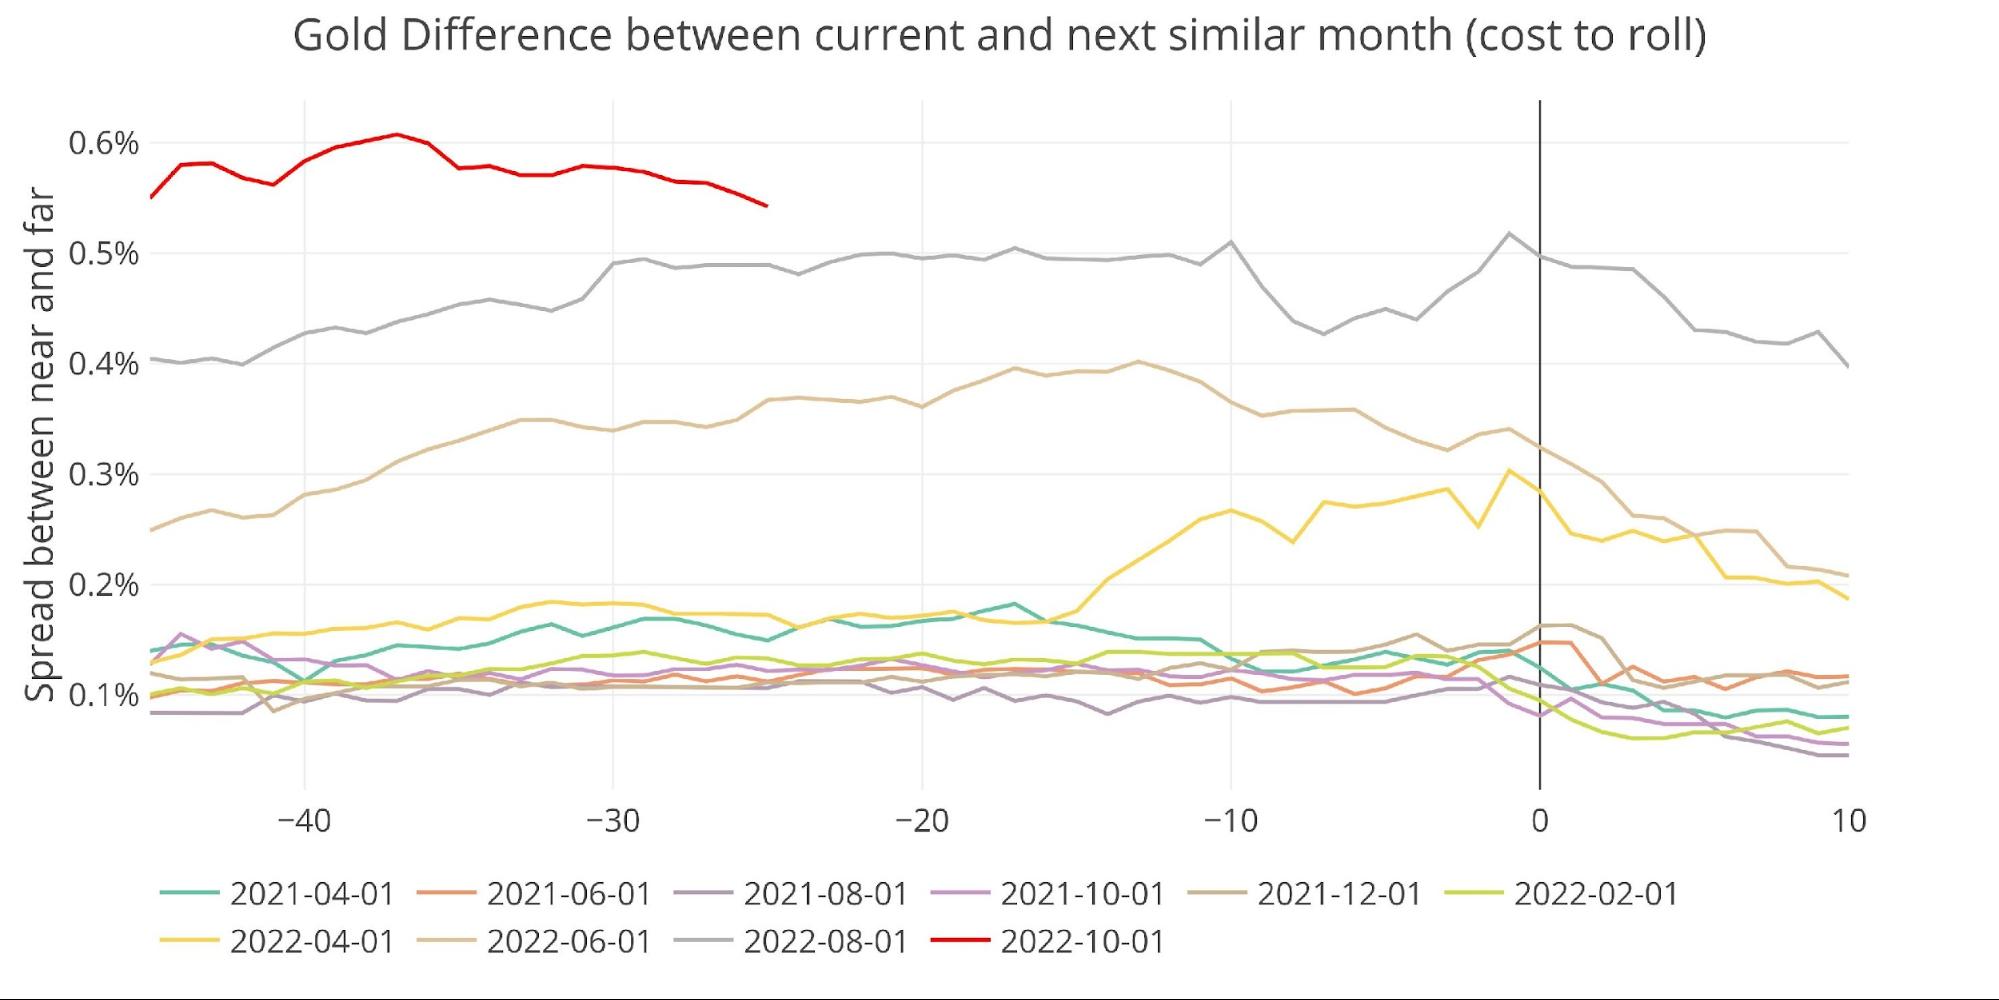
Figure: 8 Futures Spreads
The strong contango in the futures curve is one reason the spot market flipped from backwardation to contango at the beginning of the month (shown below). The analysis last month highlighted the market in strong backwardation for an extended period. Once August went into delivery, the futures contract went from August to October. The spot market flipped but the spread is already coming down quickly. The backwardation last month could be one reason for the heavy physical activity noted above. It will be interesting to see if the spread for October drops into negative territory over the next few weeks.
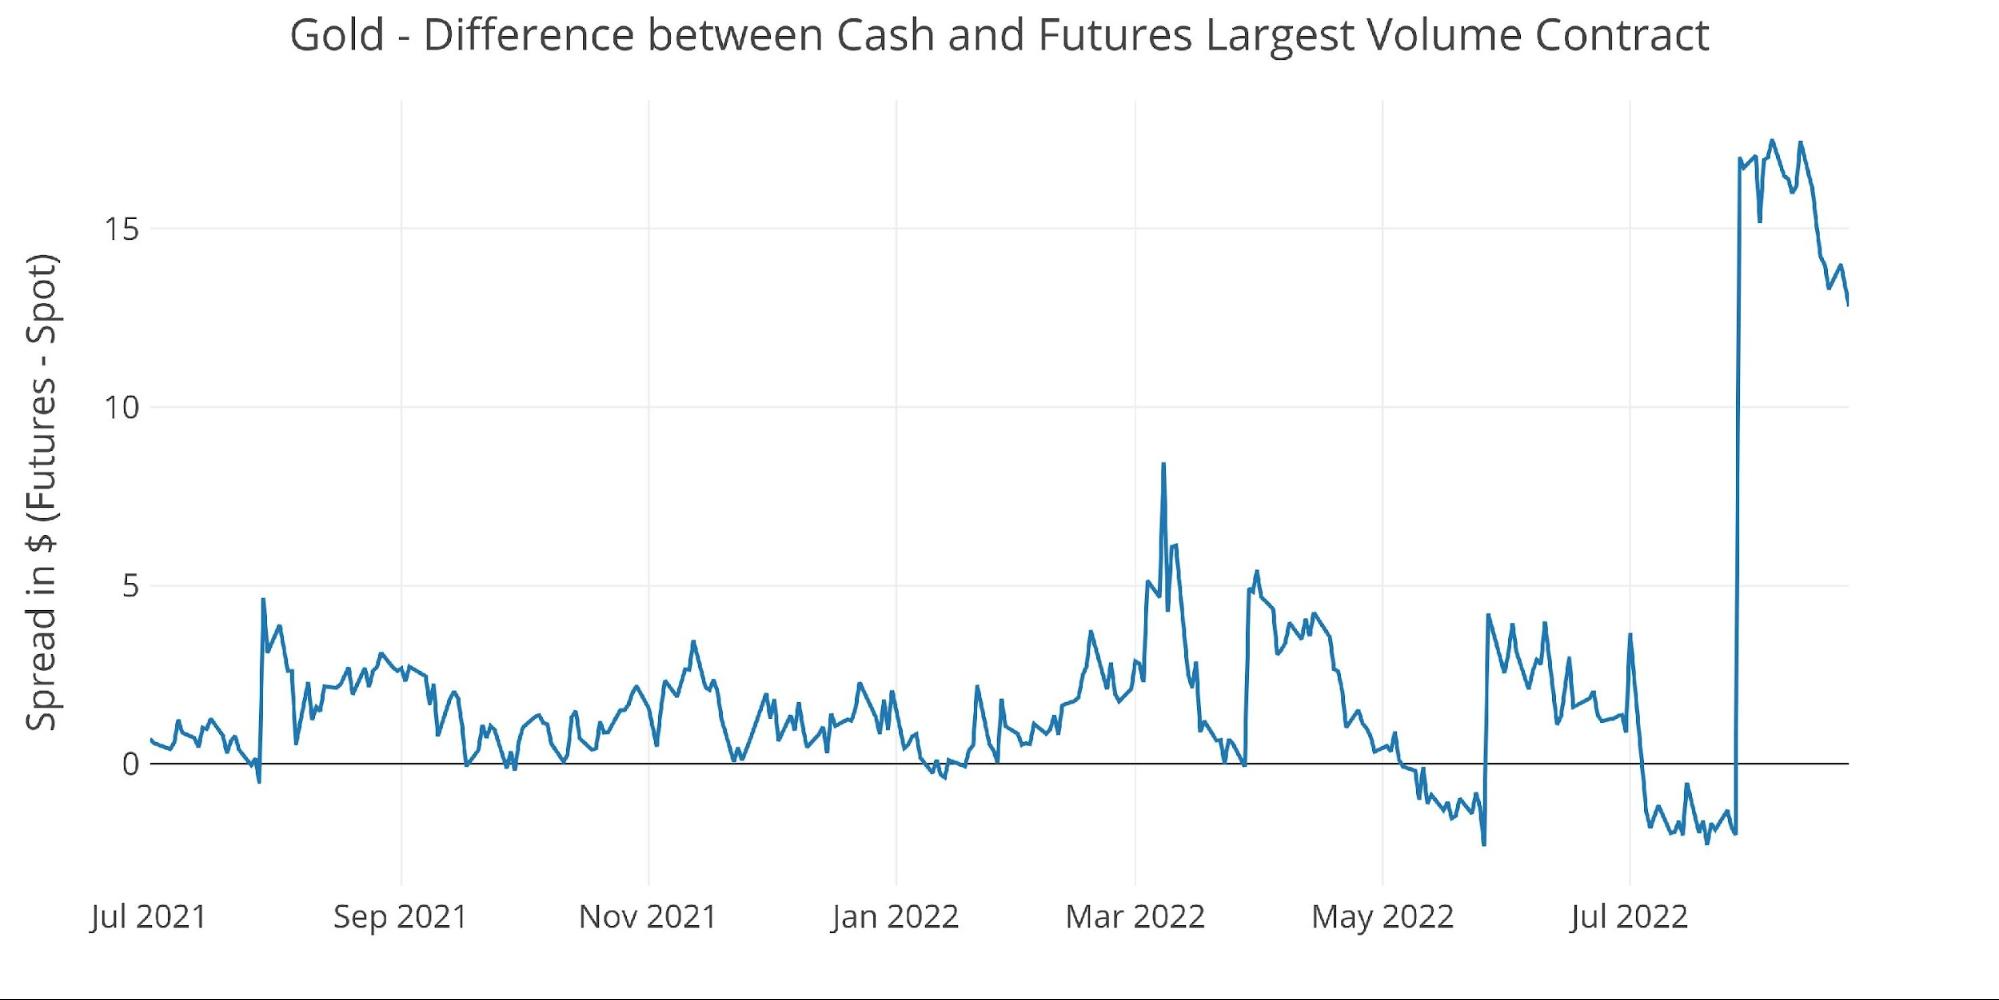
Figure: 9 Spot vs Futures
Silver: Recent Delivery Month
Silver is still not seeing the same strength as gold. Delivery volume in August is the smallest for a minor month going back to January 2021. With only 74 contracts open, August will finish well below average.
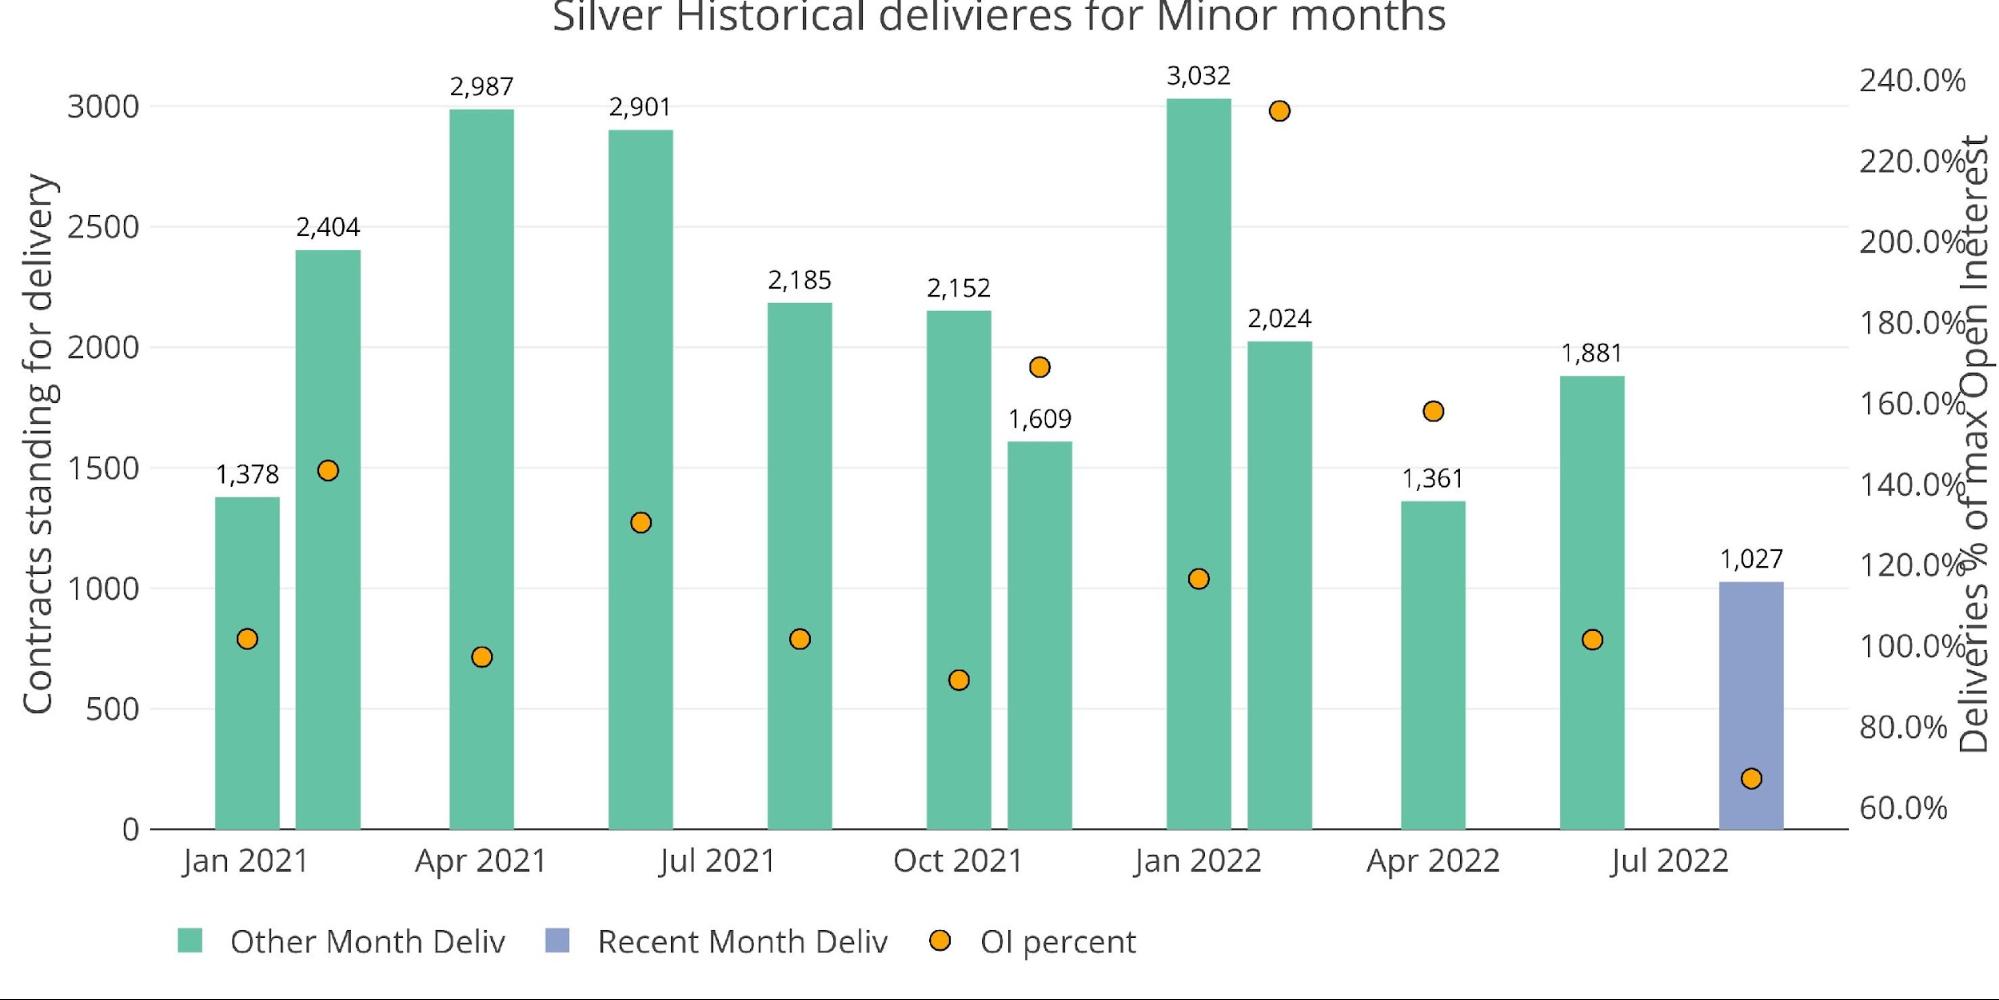
Figure: 10 Recent like-month delivery volume
Lower mid-month activity is one reason for this drop. As shown below, only about 330 contracts were opened for immediate delivery. This is about 25% of the volume seen in February contract of this year.
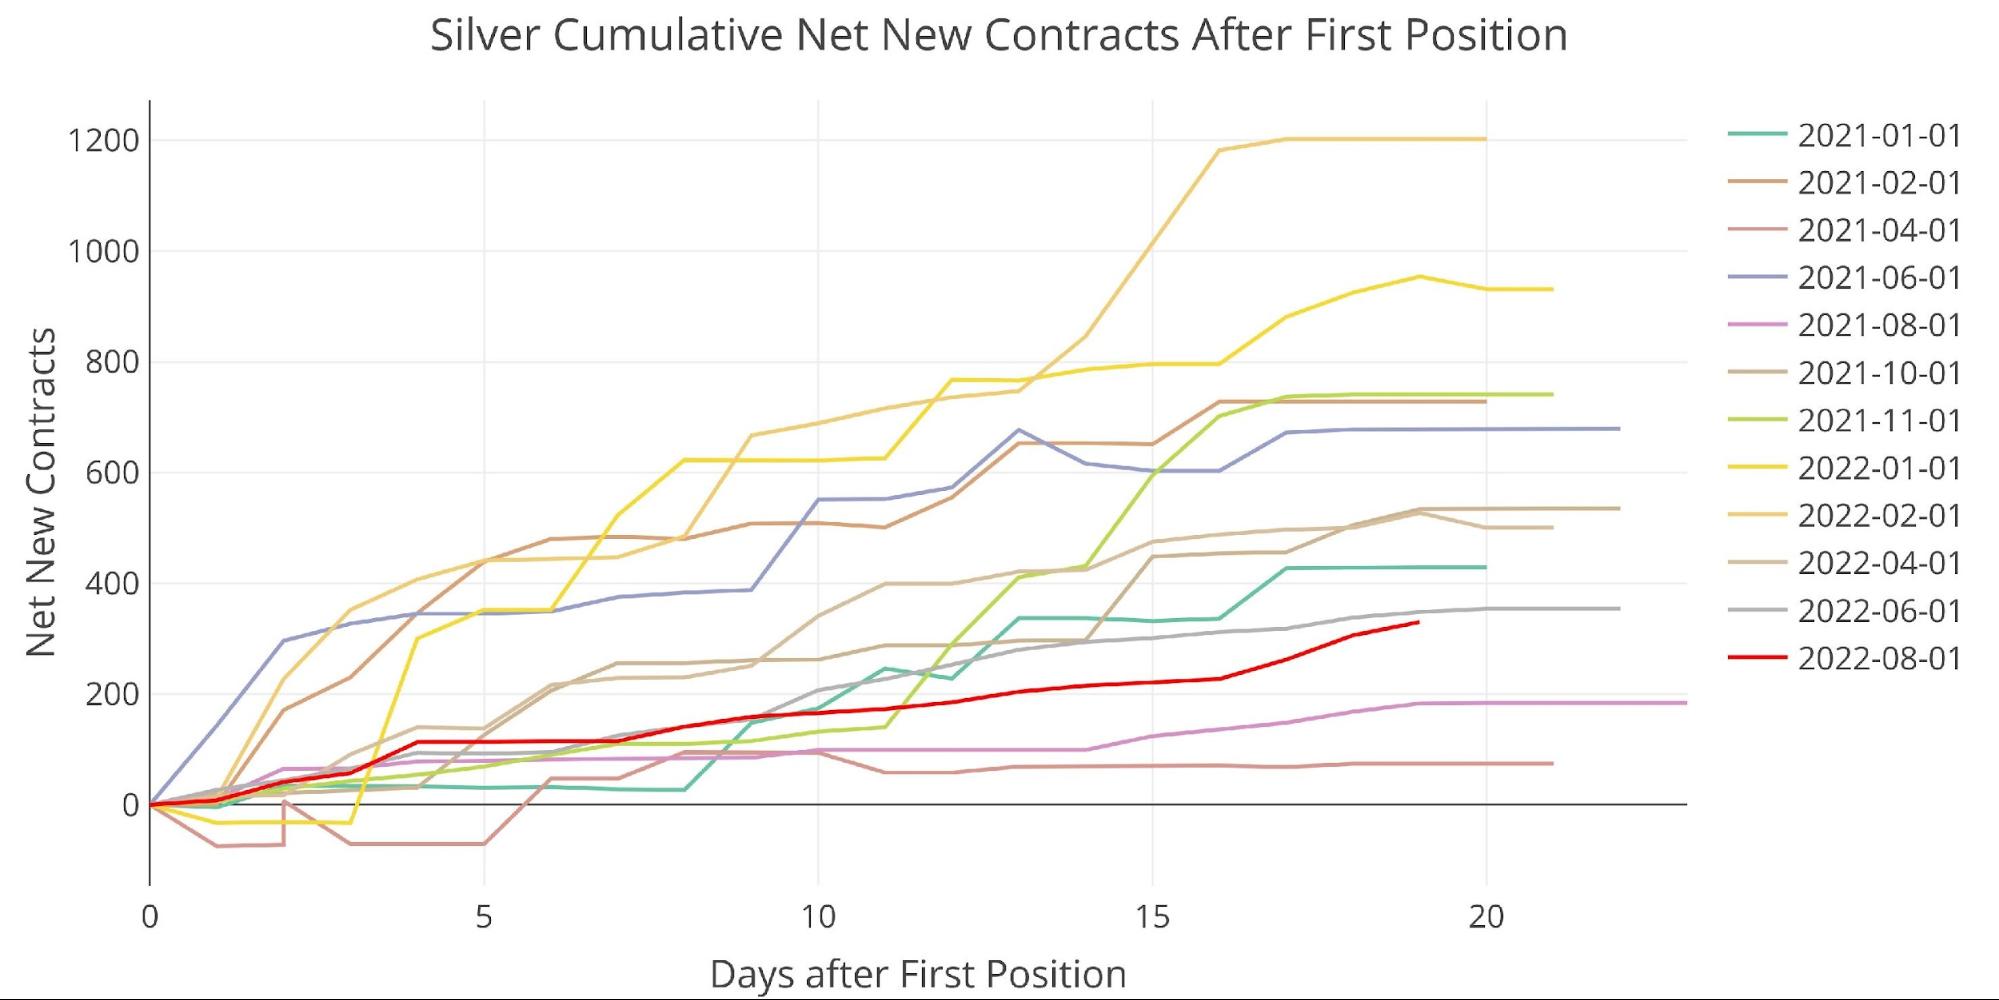
Figure: 11 Cumulative Net New Contracts
The banks are also not nearly as active. BofA restocked its delivery volume out last month (606 vs 600), but the other banks combined are only delivering 235 contracts this month.
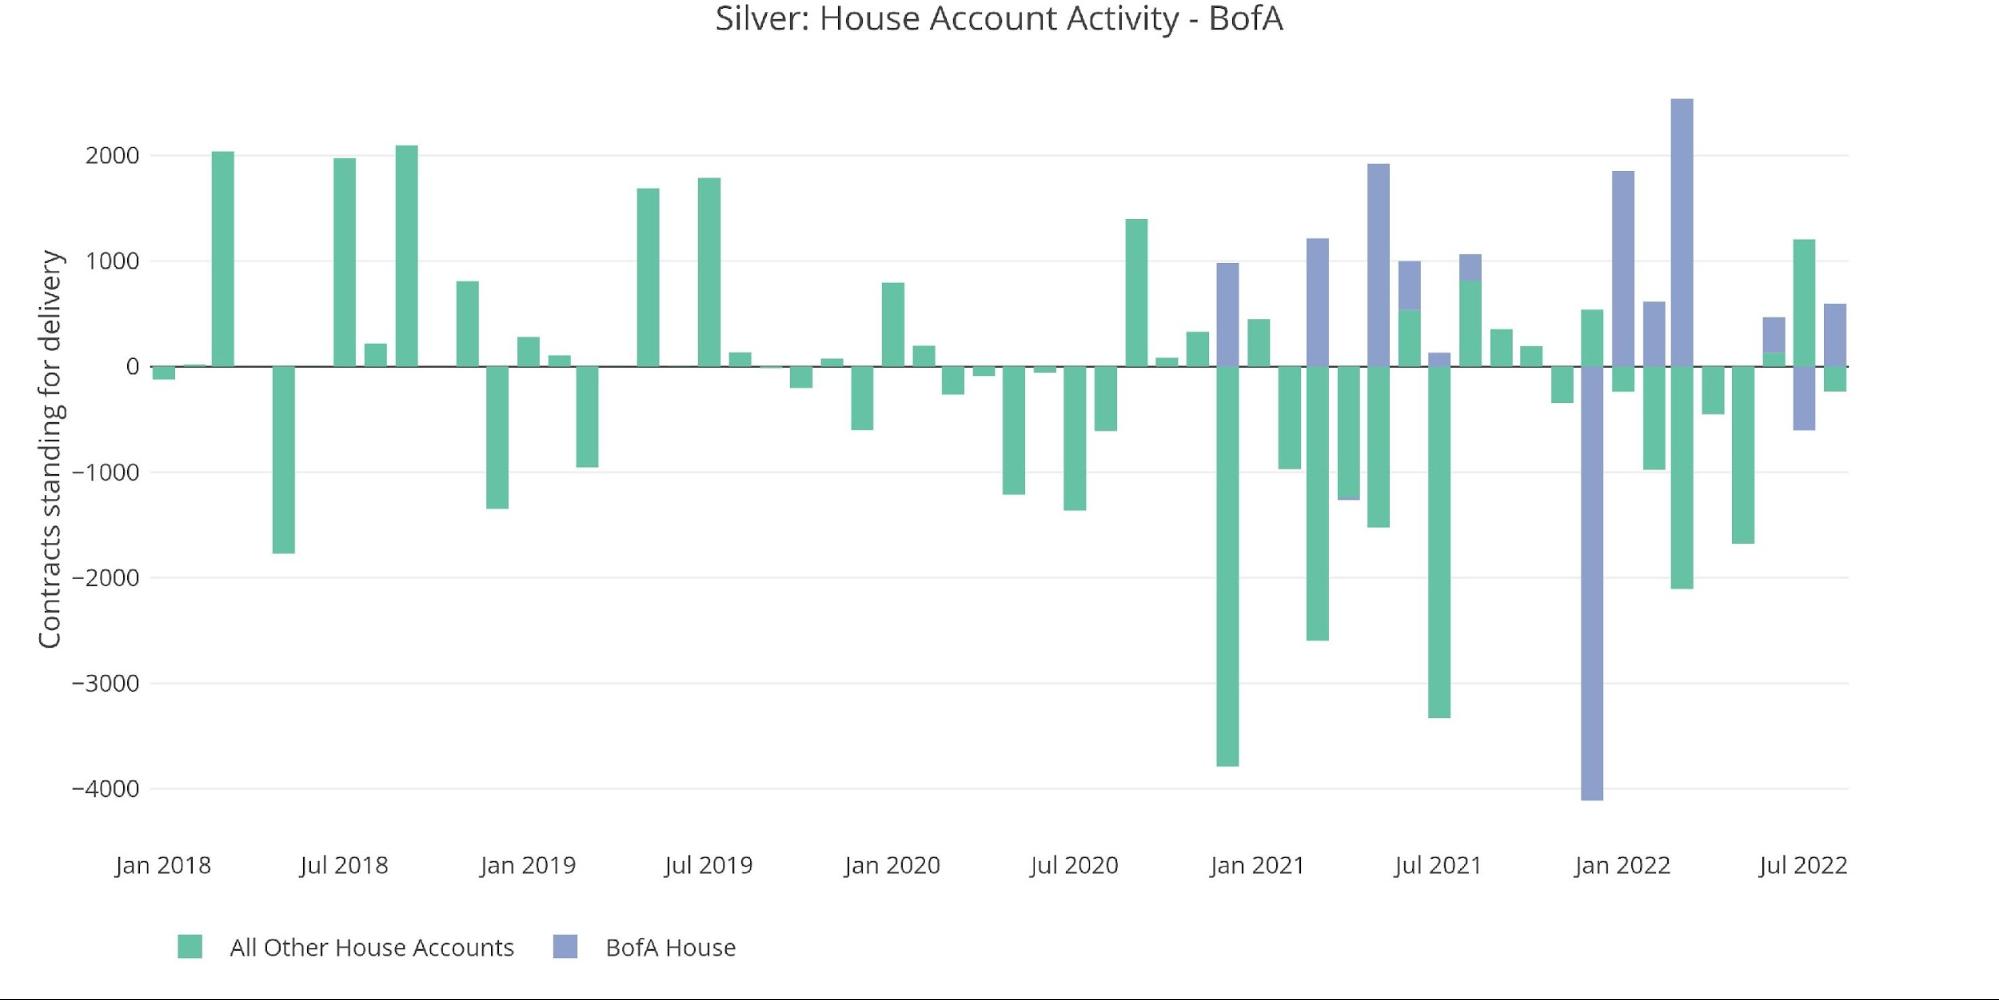
Figure: 12 House Account Activity
This August will be the weakest dollar volume since August 2018 with only $105M delivered, less than half the amount from last August.
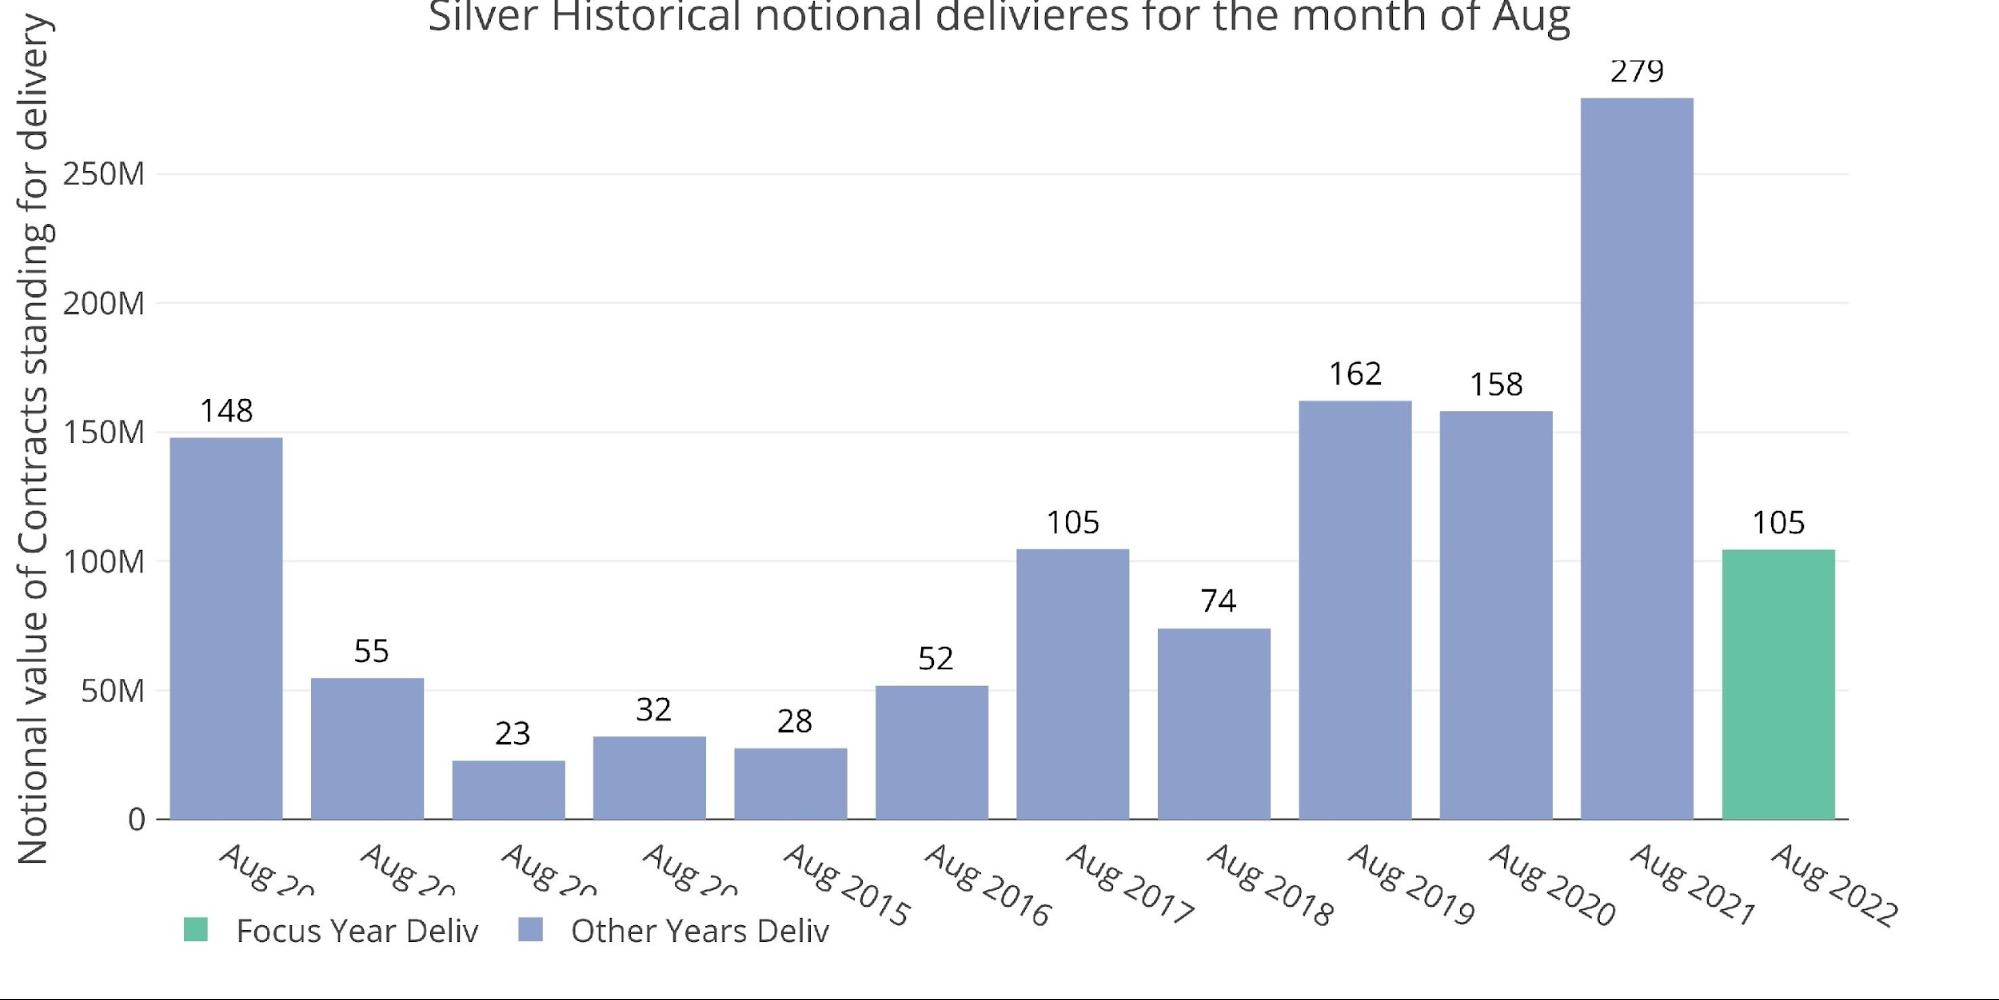
Figure: 13 Notional Deliveries
One area where silver continues to impress is the drain on Registered. Outflows continue from Registered with 2.77M ounces out on the most recent day. Registered is down more than 65% since the all-time peak in December 2020. At the current pace, Registered will be empty within a year!
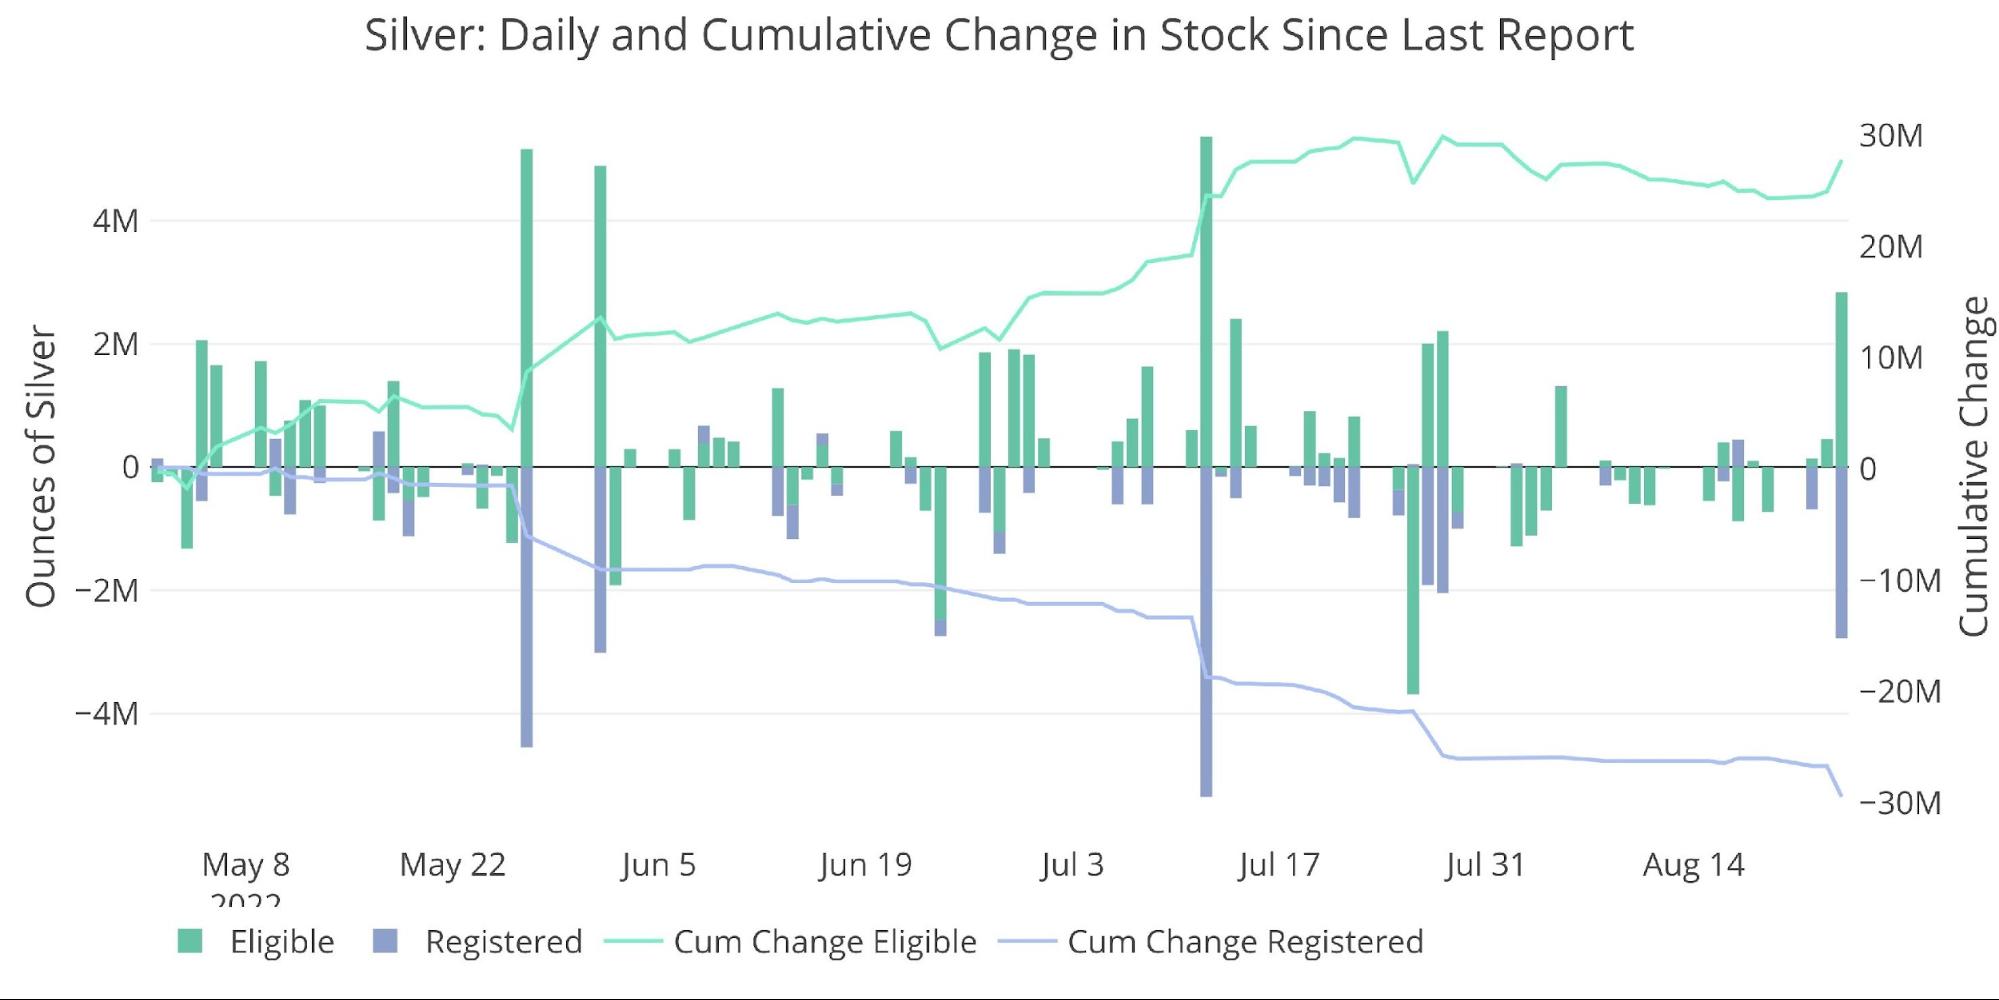
Figure: 14 Recent Monthly Stock Change
Silver: Next Delivery Month
September silver is starting to show signs of life! With 4 days to go, September has at least entered the pack. A lot will still happen in the next few days, but recent activity could be a good sign given where the contract stood a few weeks ago.
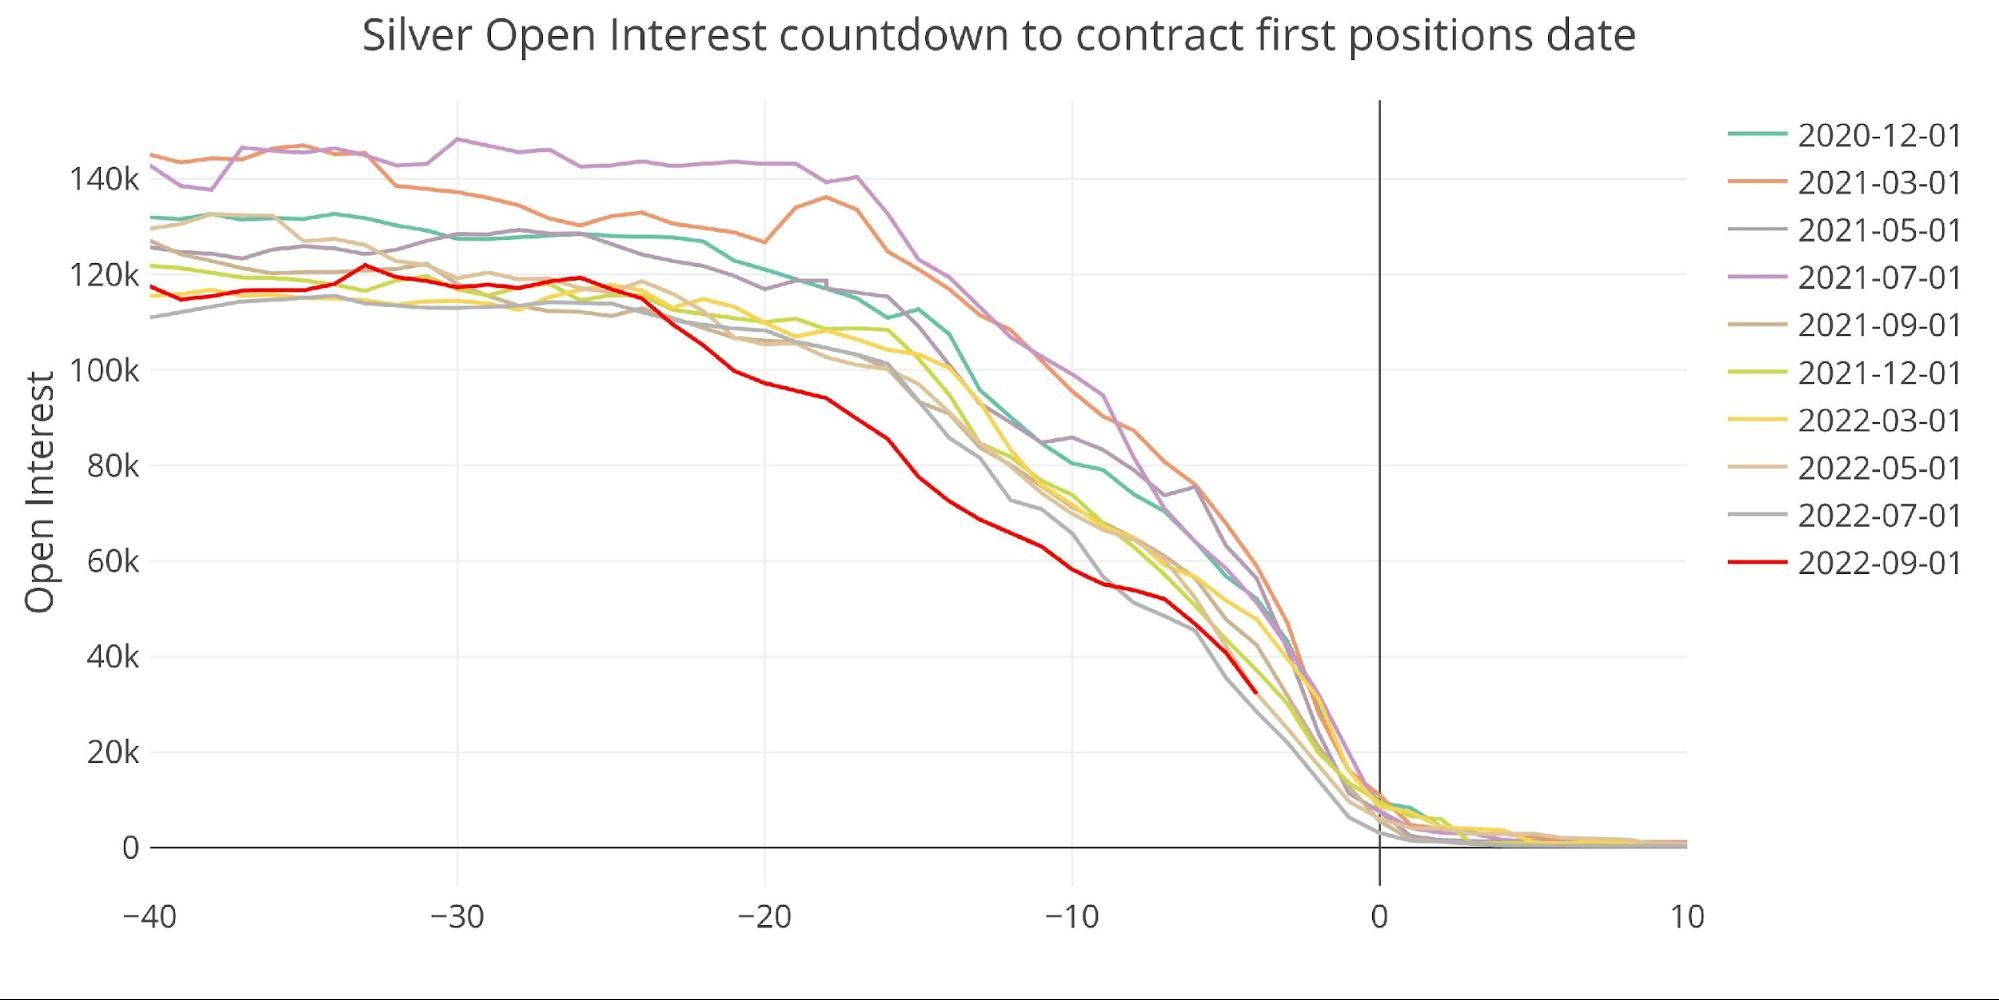
Figure: 15 Open Interest Countdown
Last month finished quite weak so it would be good to see a turnaround.
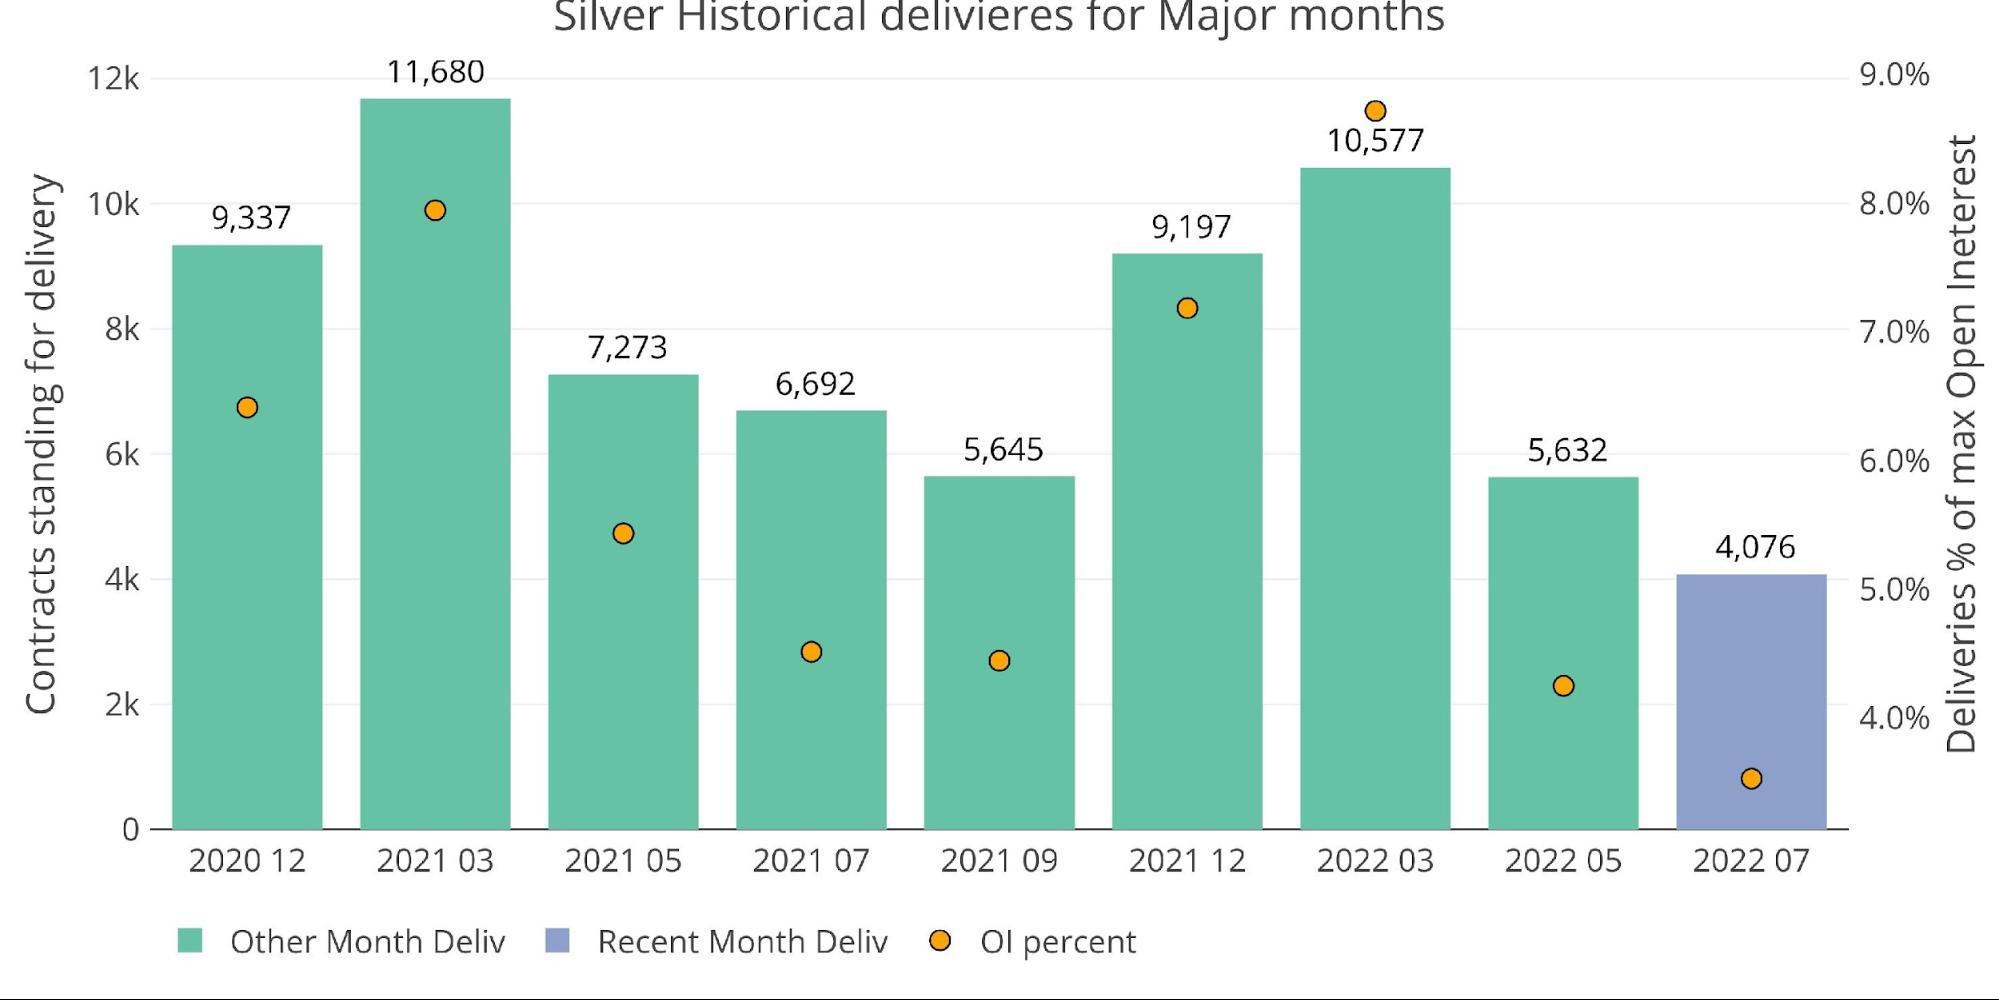
Figure: 16 Historical Deliveries
The market is still in strong contango but has been dipping down as the contract approaches First Notice.
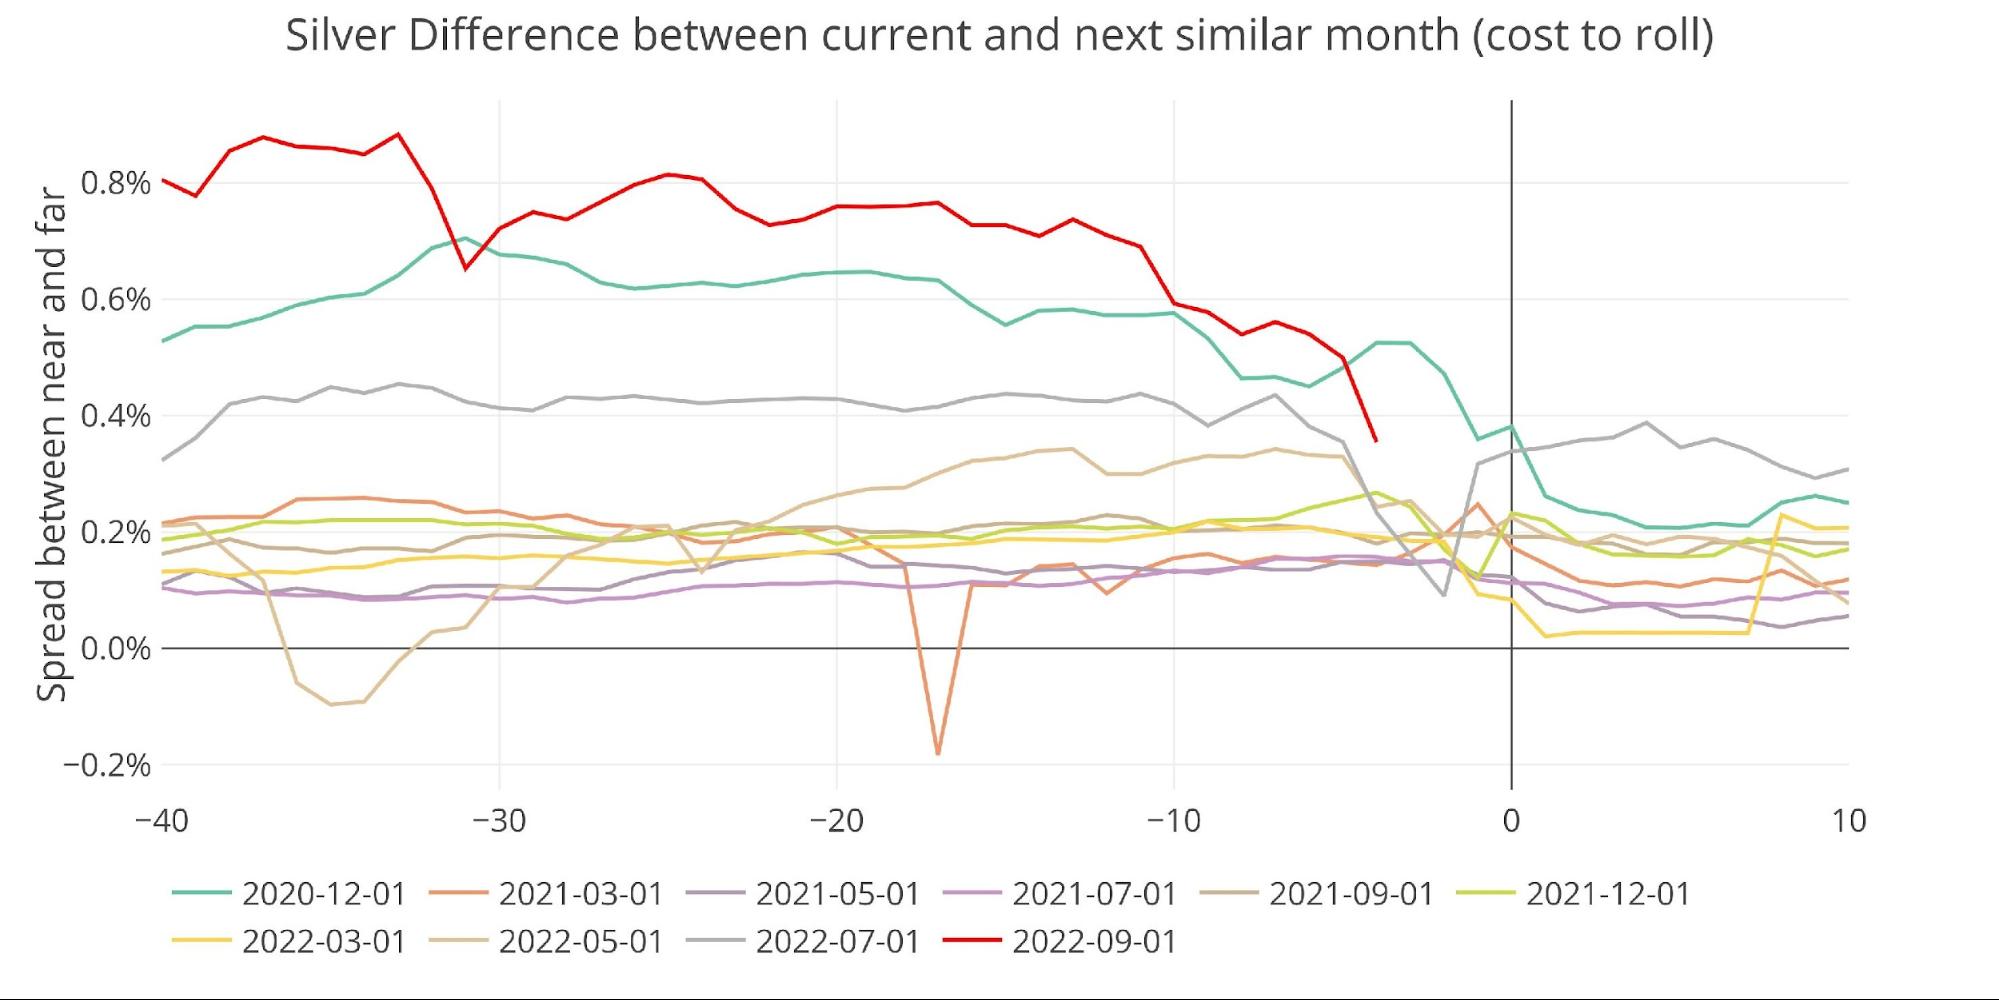
Figure: 17 Roll Cost
While the futures market remains in contango, the spot market is in solid backwardation. The market is in the strongest backwardation since silver first saw its massive price spike back in summer 2020.
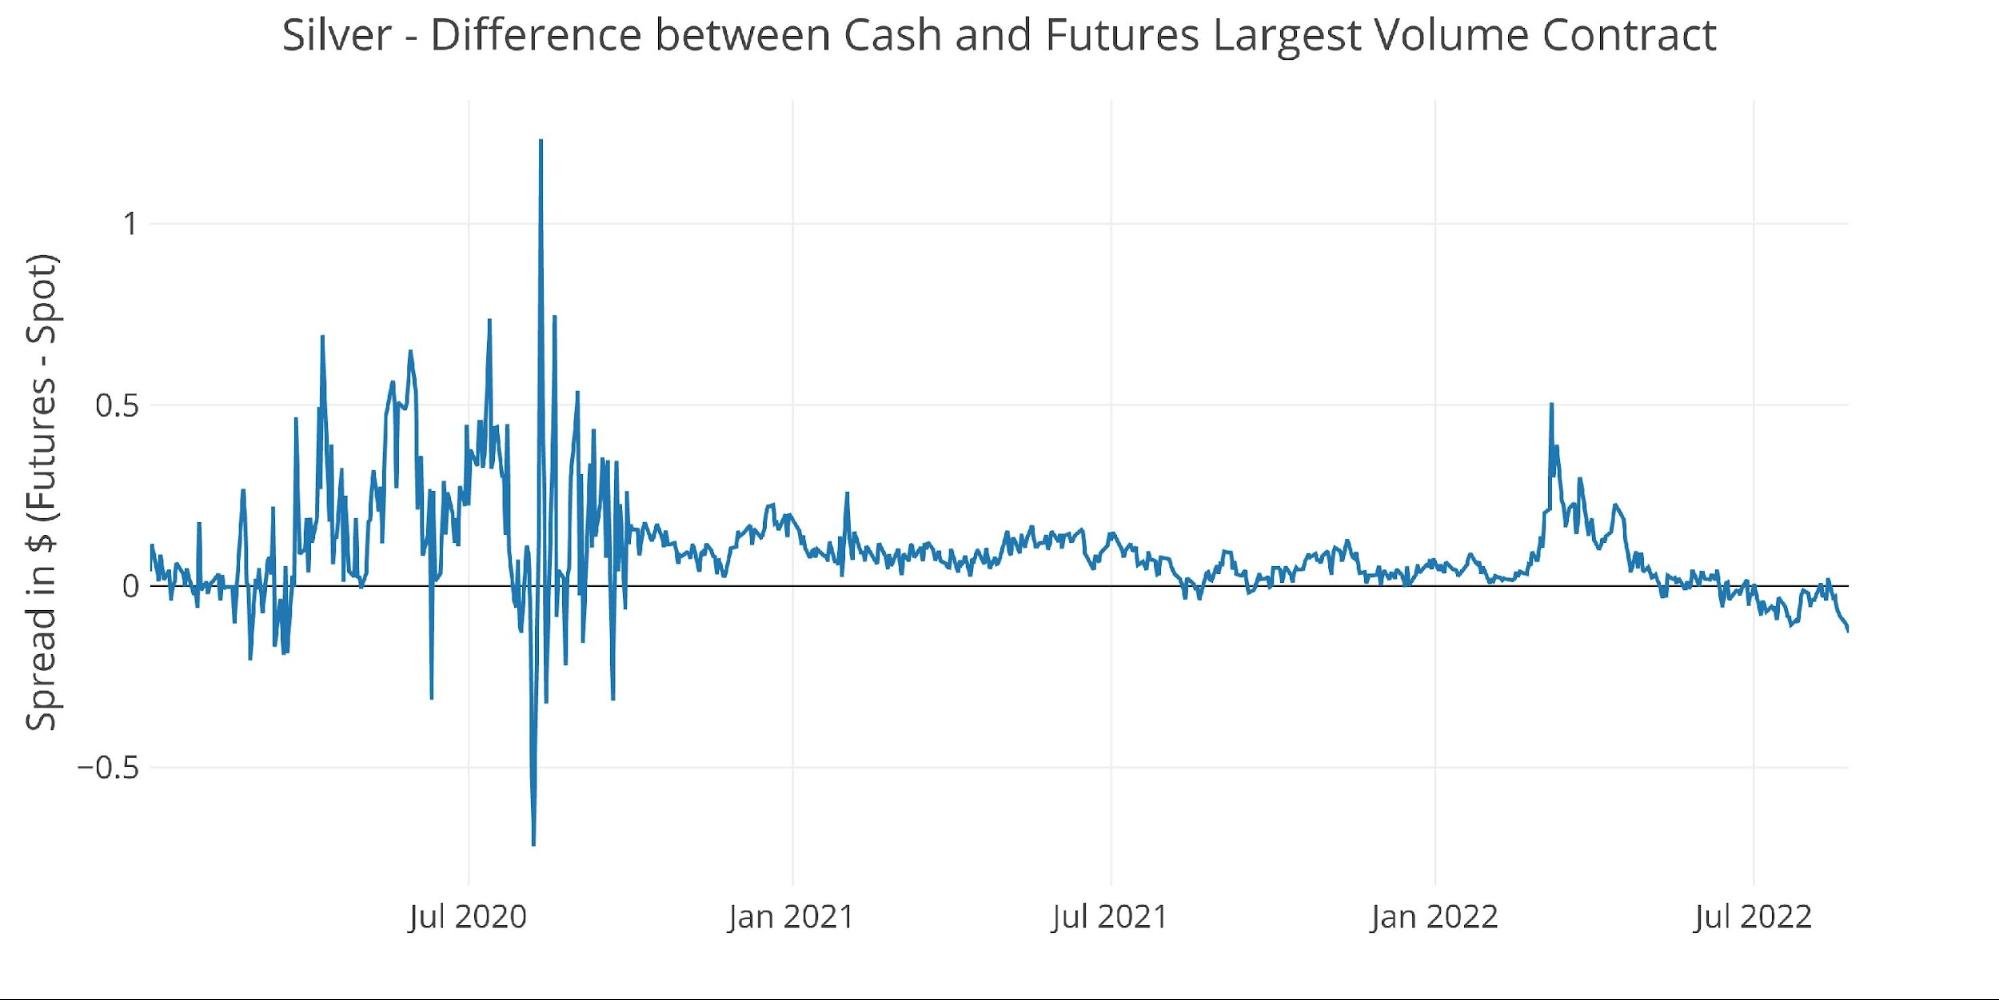
Figure: 18 Spot vs Futures
Wrapping up
The gold price clearly does not reflect all the activity going on under the surface. The demand for physical is really starting to materialize with no clear catalyst (e.g., Covid lockdowns or Ukraine/Russia war). The Comex data is important because it will likely be the first place to show stress in the gold/silver market.
The price is currently contained by an unlimited paper supply that can always be created to meet paper demand. The COTs report shows that this isn’t even needed as Managed Money has gone cold on gold. Things start to change when physical supply cannot be found to meet physical demand. The data is pointing to this as a real possibility in both gold and silver. The outflow of metal combined with the increased delivery volume in gold points to something happening underneath the surface while the paper futures market still plays the same old game. Buckle up! Things could get very interesting in the months ahead!
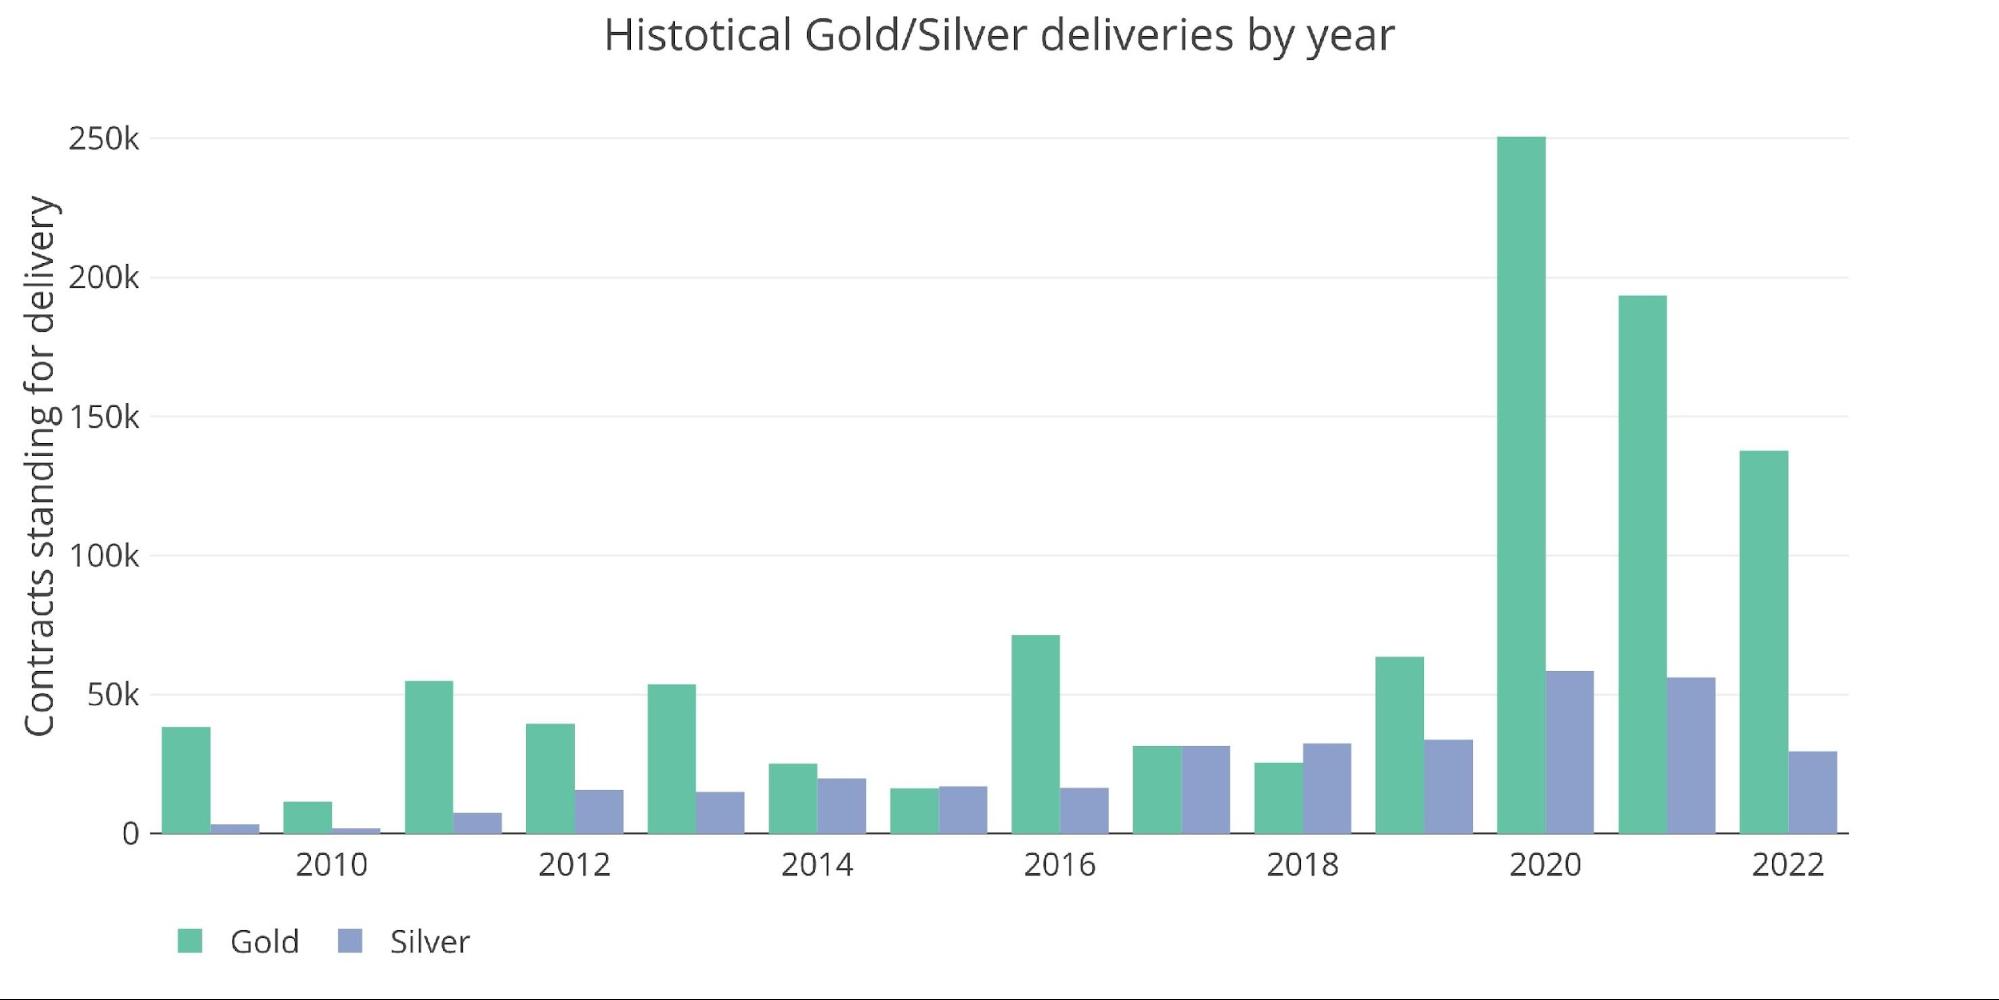
Figure: 19 Annual Deliveries
Data Source: https://www.cmegroup.com/
Data Updated: Nightly around 11PM Eastern
Last Updated: Aug 24, 2022
Gold and Silver interactive charts and graphs can be found on the Exploring Finance dashboard: https://exploringfinance.shinyapps.io/goldsilver/

Call 1-888-GOLD-160 and speak with a Precious Metals Specialist today!
Buka akaun dagangan patuh syariah anda di Weltrade.
Source link