Strange activity continues at the Comex!
Gold: Recent Delivery Month
Delivery volume for February was a little less than half the contracts open at first notice. 6,005 contracts were delivered with 7,370 remaining in open interest. This was a much larger relative delivery than December which saw less than a third of contracts delivered on the first day. Things seemed suspicious back in December, but this month had a potentially bigger red flag.
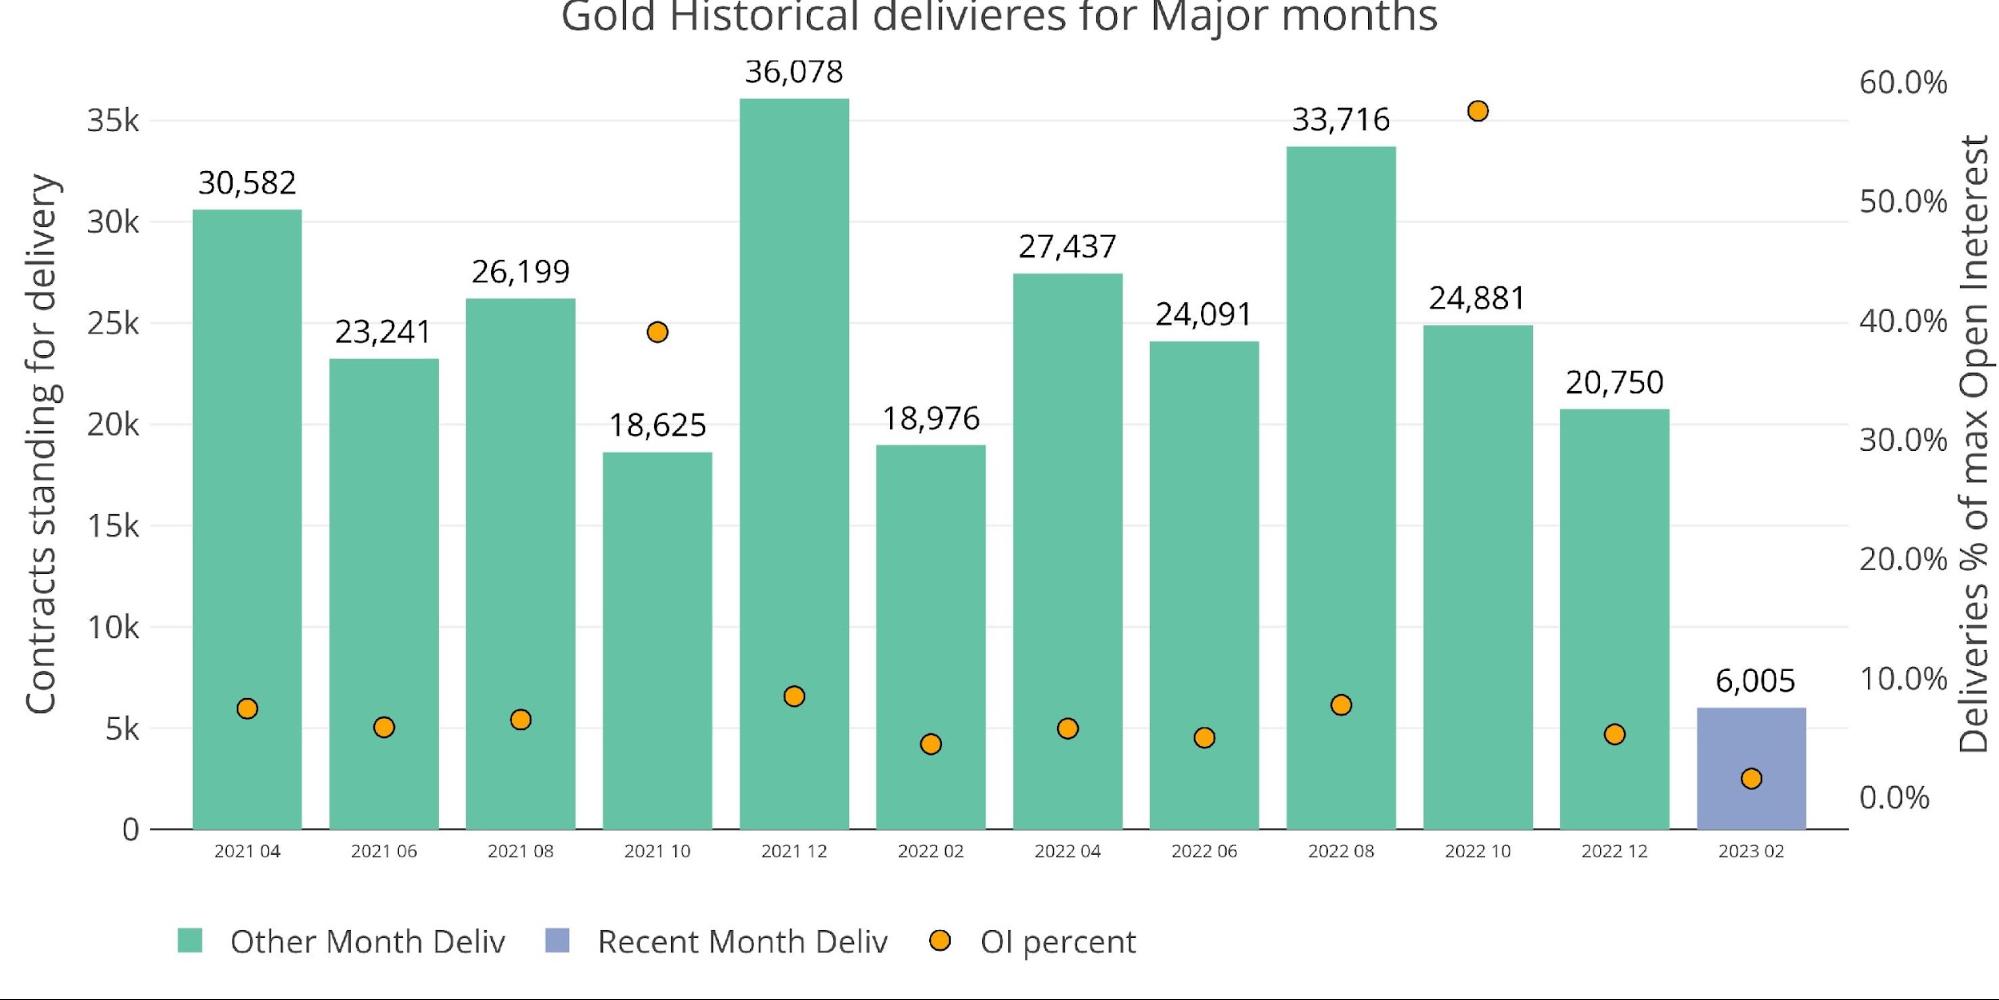
Figure: 1 Recent like-month delivery volume
The chart below shows the drop from First Position (the day before delivery starts as a blue bar) into First Notice (green bar). As shown, the drop from blue to green was abnormally large this month.

Figure: 2 24-month delivery and first notice
The chart below more clearly shows the relative drop into close. 54% of open interest closed or rolled in the final day. The next largest roll amount over the last three years was 42% back in June 2021.
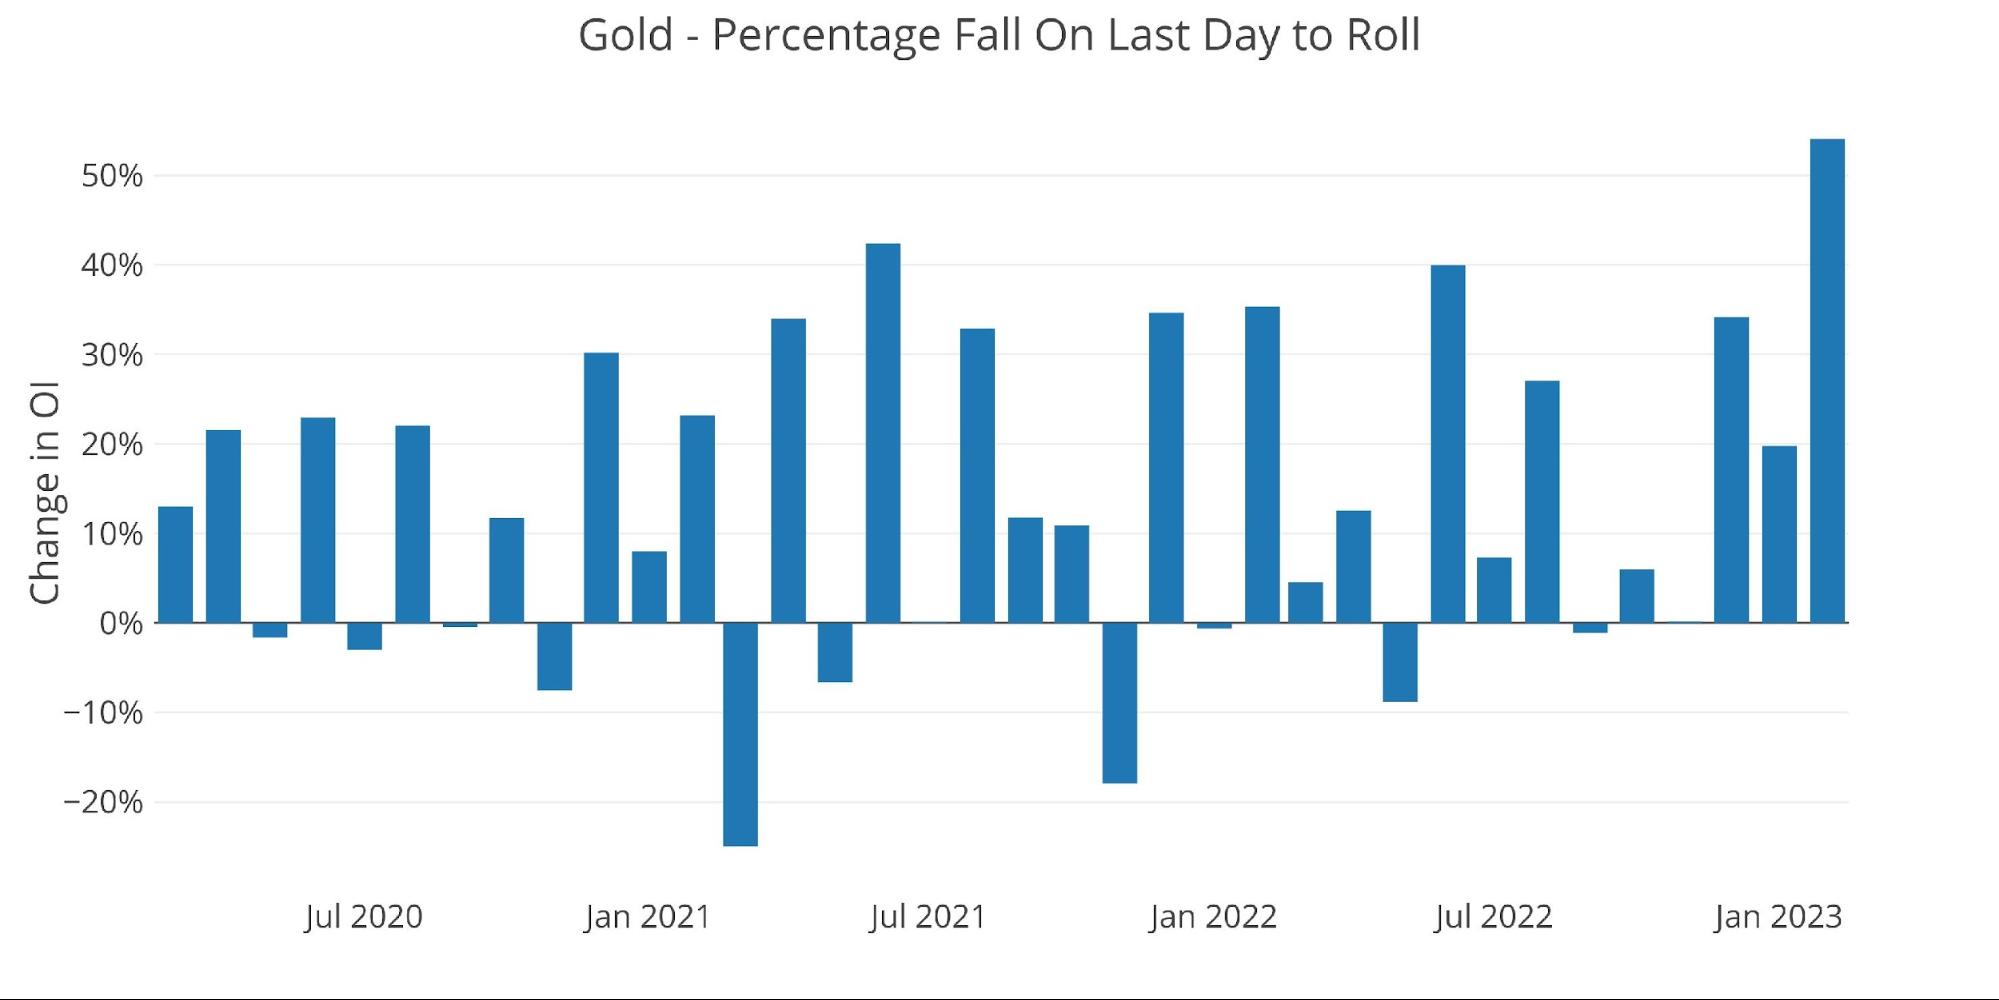
Figure: 3 Drop into Close
The chart below shows how February was trending very strongly. With three days to go, it was at the top range of open interest. Then the last two days saw a significant drop in contracts.
Last month, I speculated that gold was starting to look like silver did 18 months ago. This was leading up to the physical squeeze that was seen in silver in the second half of 2022. Silver started to see a lot of contracts drop on the final day before delivery started. The speculation was that supplies were tight so contract holders were being motivated to roll rather than deliver.
That speculation turned out to be accurate as the physical squeeze in silver really intensified in 2022 and prices recovered. Now gold is setting up very similar to silver on a 12-18 month lag. Does this mean that 2023 could start to see massive outflows from Comex vaults? The data shows that outflow has already started. If it were to intensify this year, that could really begin to stress the system. The Comex will have a tougher time defending the gold market than it did the platinum market.
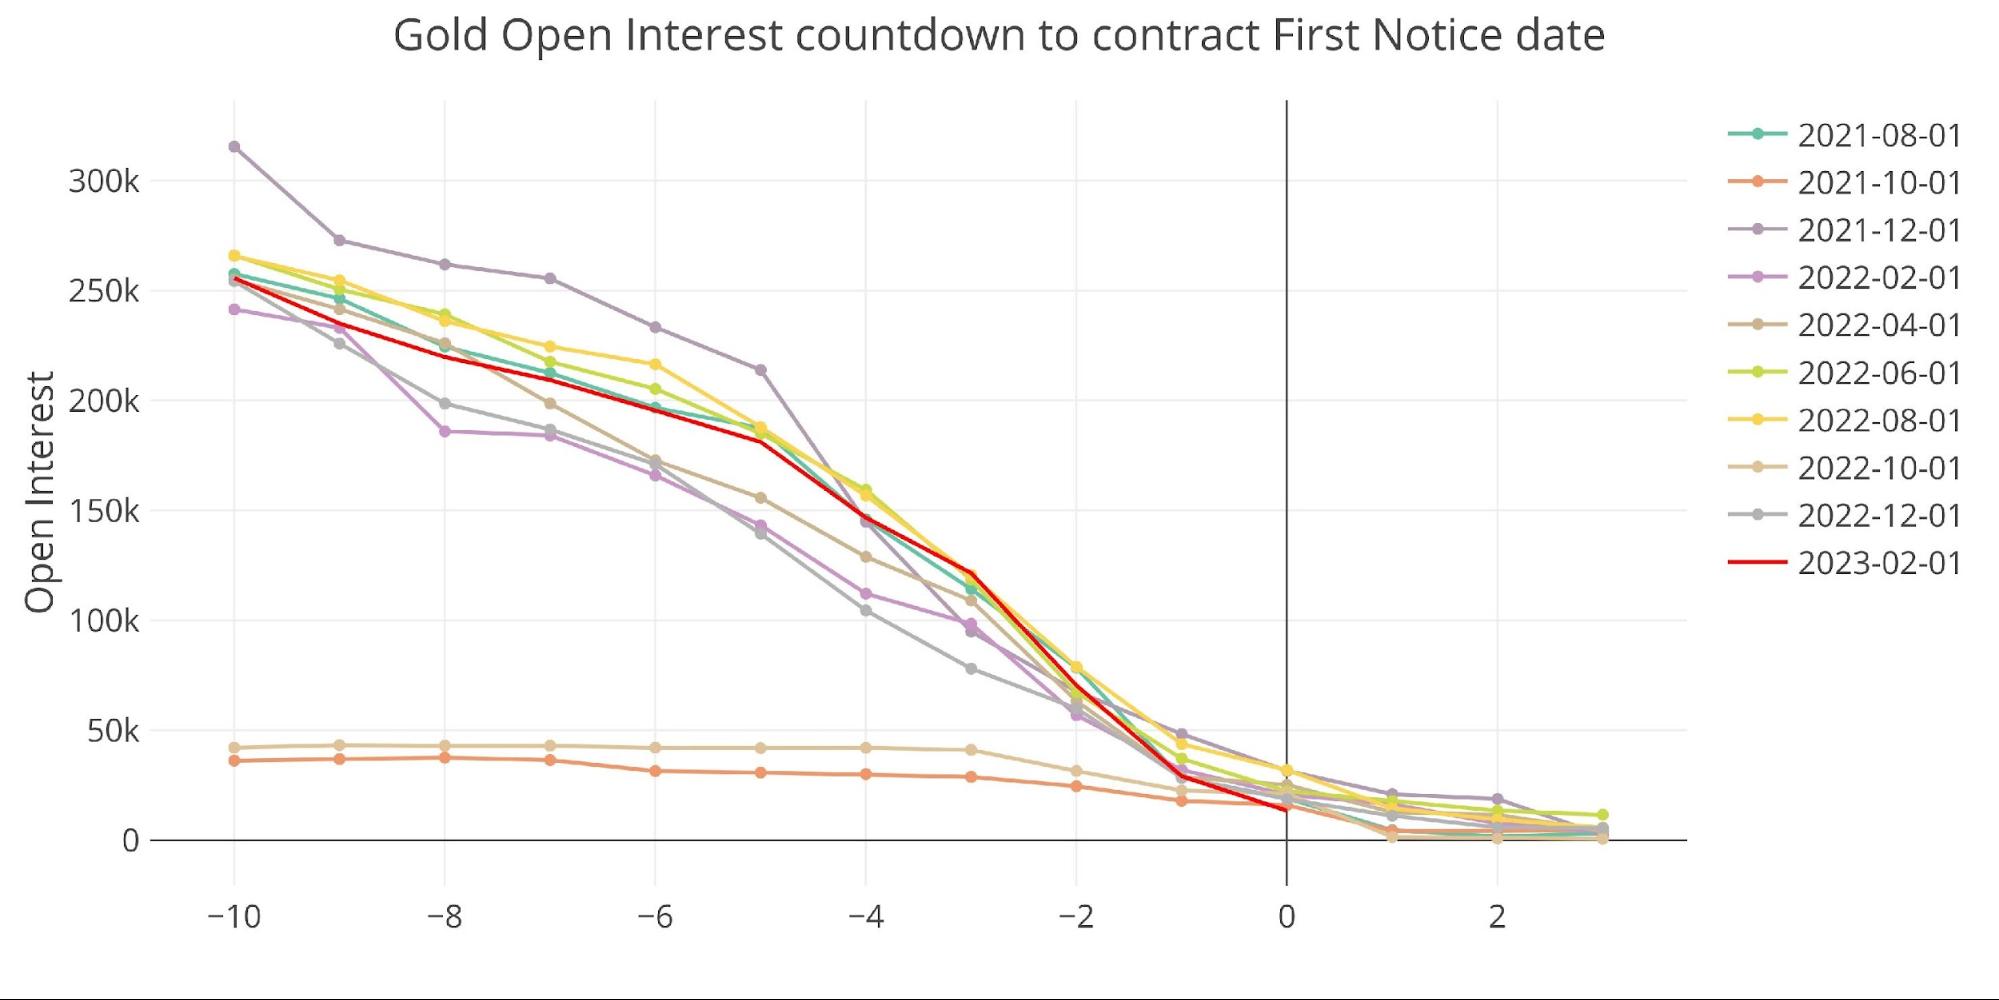
Figure: 4 Open Interest Countdown
BofA is back in the market as a major buyer. They may be restocking the inventory they dished out in July and November. They have restocked to then be the backstop in the market when delivery volume sees a surge.
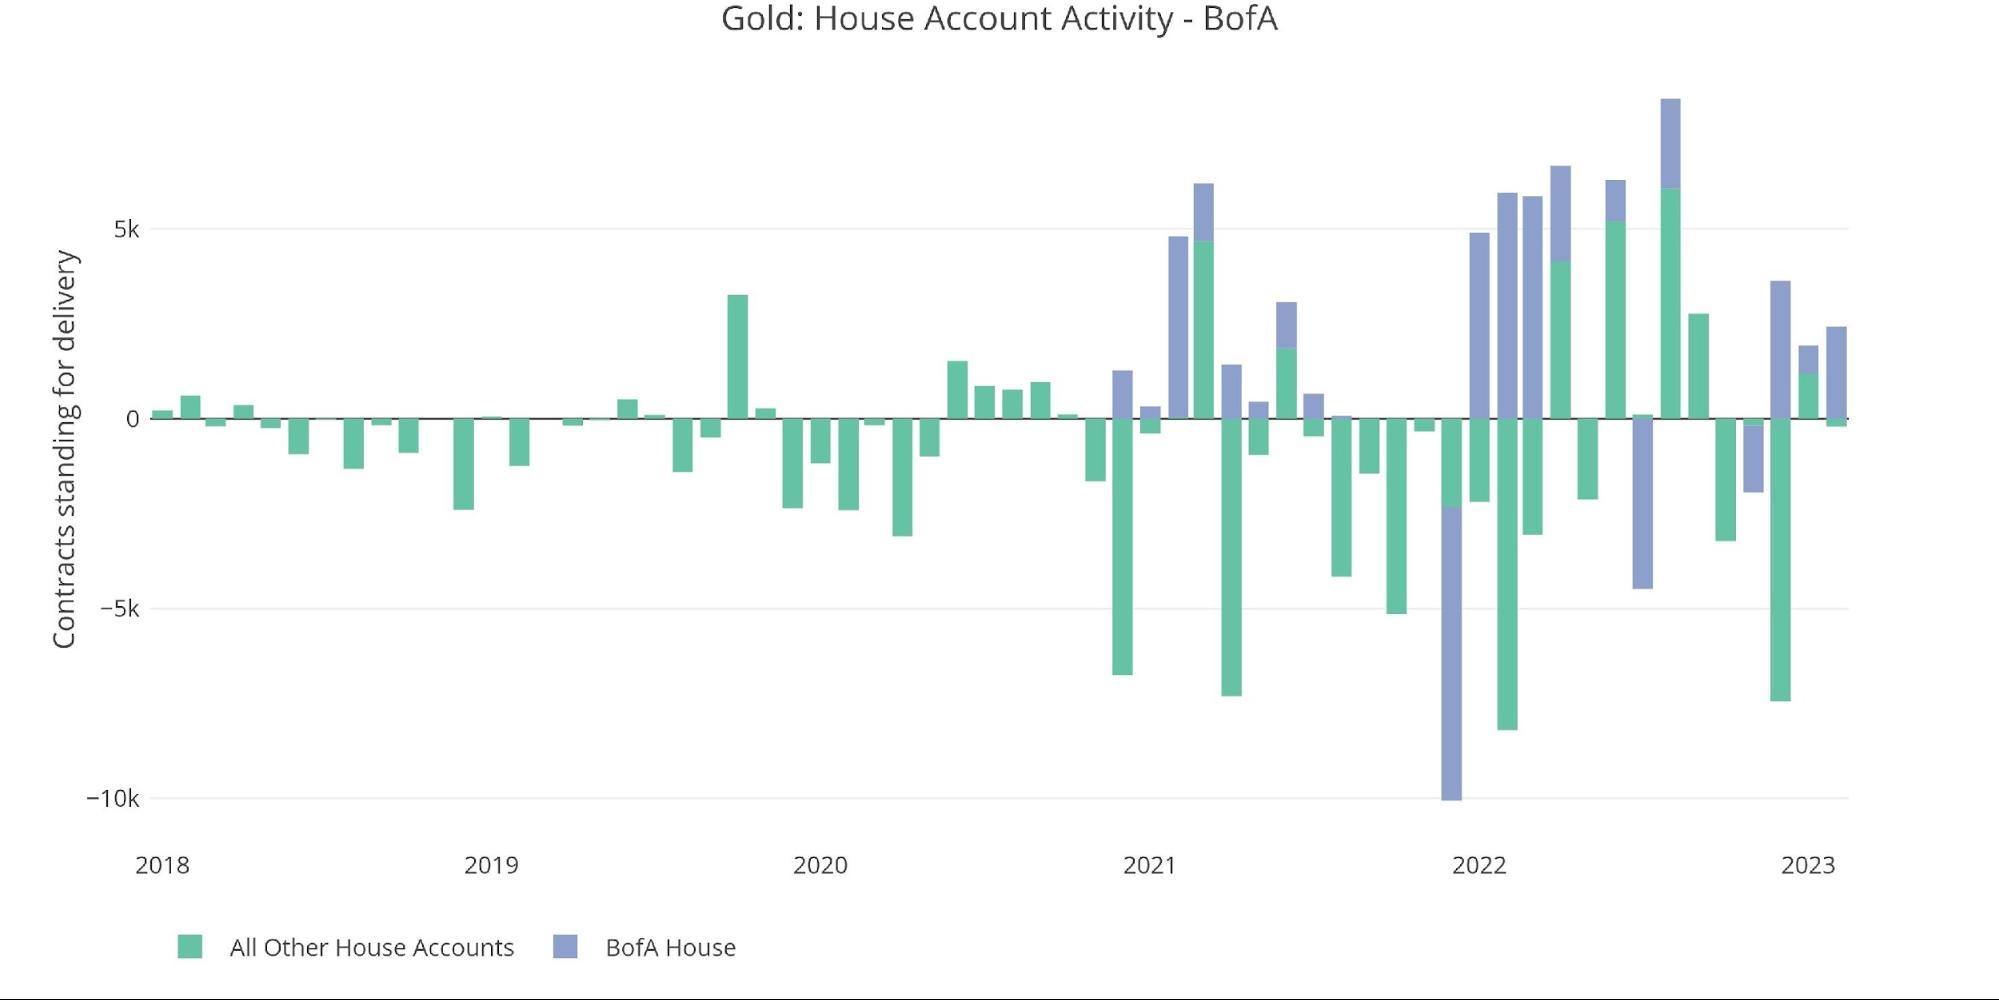
Figure: 5 House Account Activity
As mentioned above, the physical outflows have been underway for some time. Since last July, gold has seen more than 10.6M ounces flow out of the vault. If this picks up steam, the Comex will run out of gold before the end of the year!
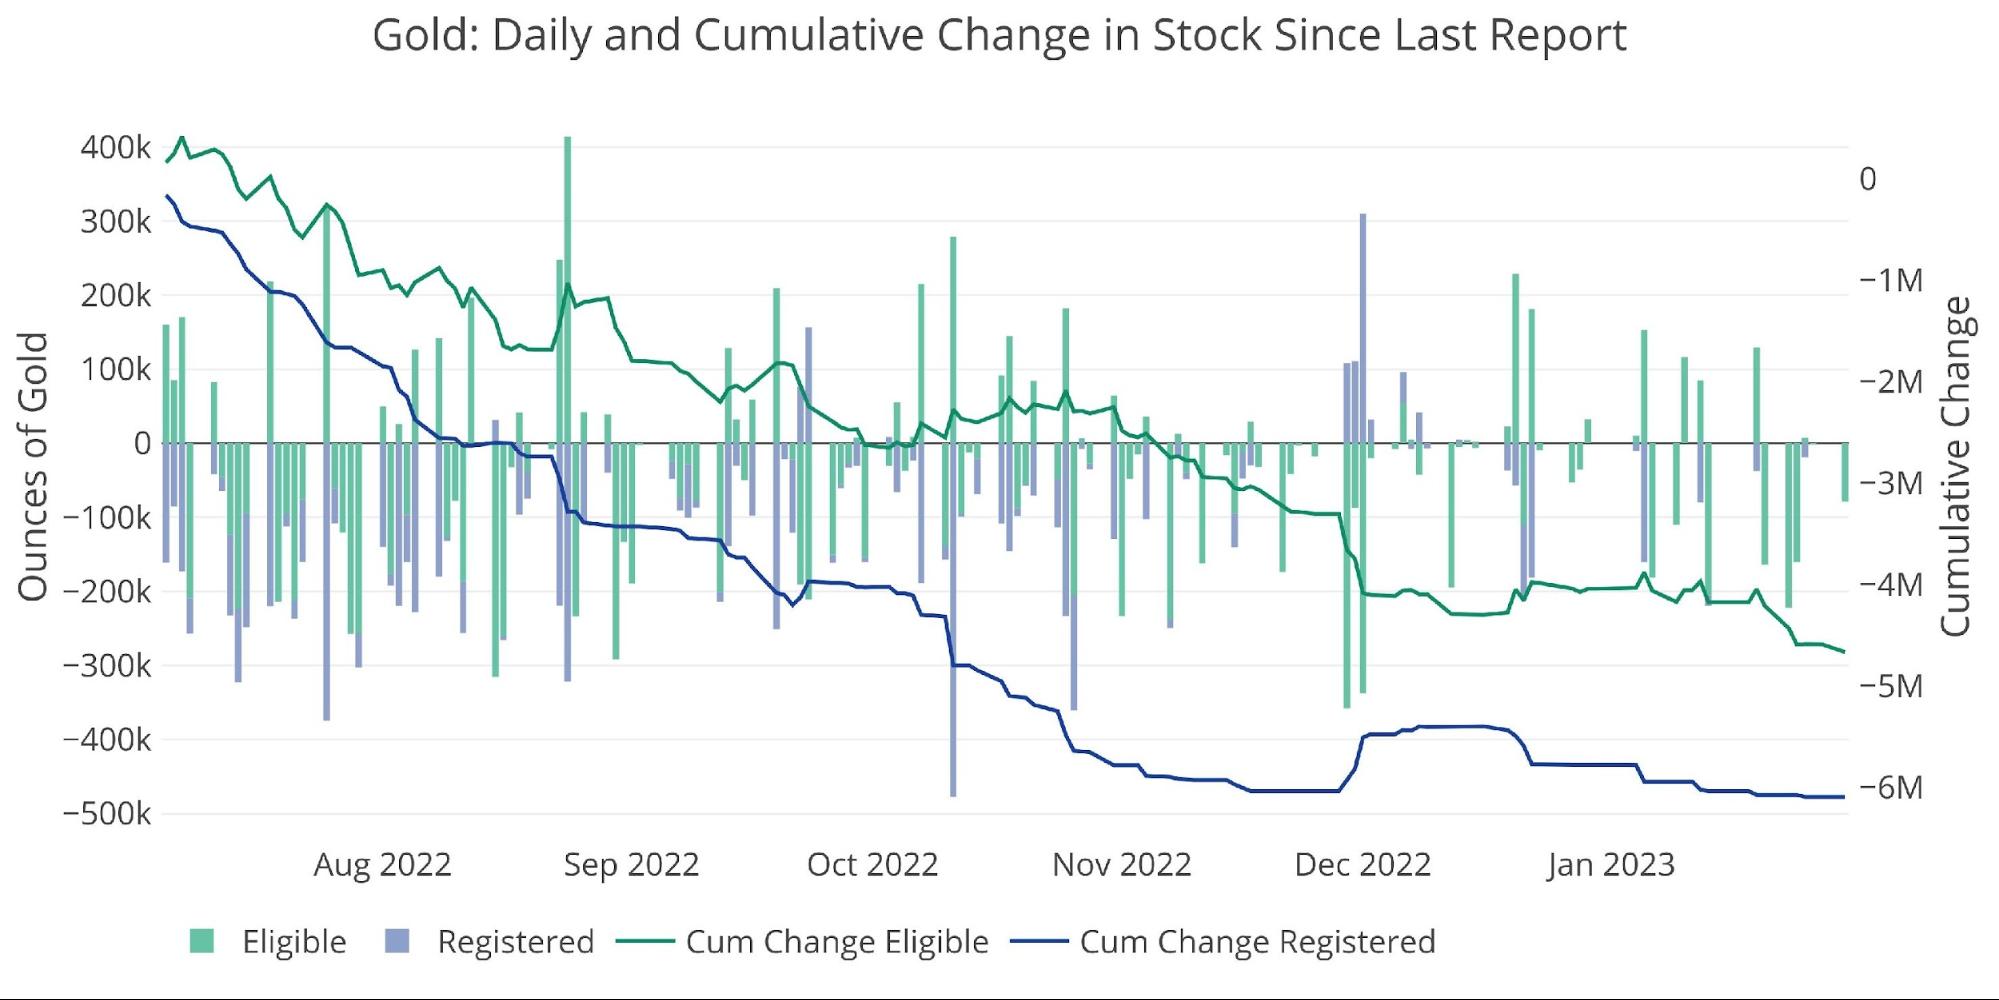
Figure: 6 Recent Monthly Stock Change
The chart below shows total net daily change from the chart above. As shown, there is almost no metal flowing into the vault. There have only been 3 days of a net increase greater than 100k since July 1st. On the other hand, net outflows are seeing regular drops of more than 100k, oftentimes occurring multiple times in a single week.
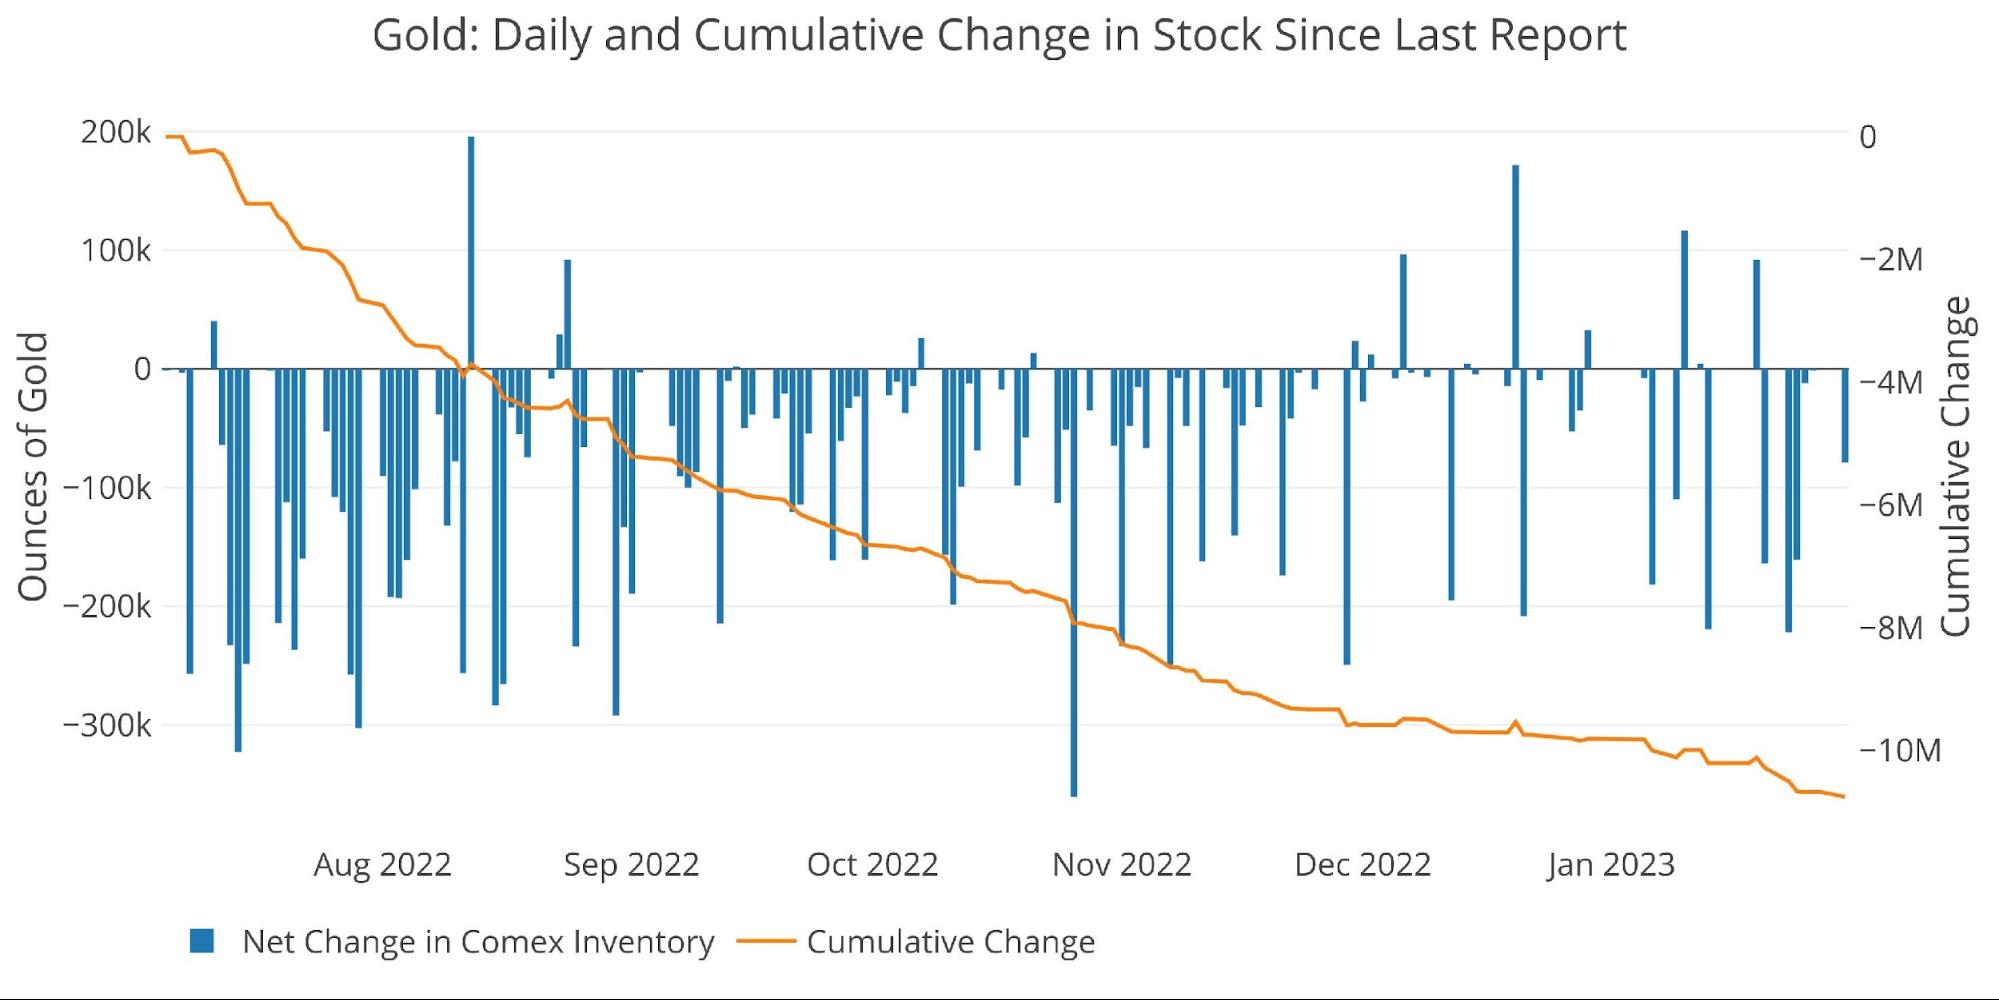
Figure: 7 Recent Monthly Stock Change
Gold: Next Delivery Month
Open interest for March is looking to be middle of the pack to start.

Figure: 8 Open Interest Countdown
Looking at it as a percentage of Registered shows it is in the higher range, but not in record territory at the moment.

Figure: 9 Countdown Percent
The minor months have trailed off some in recent months. Again, something similar happened in silver last year.
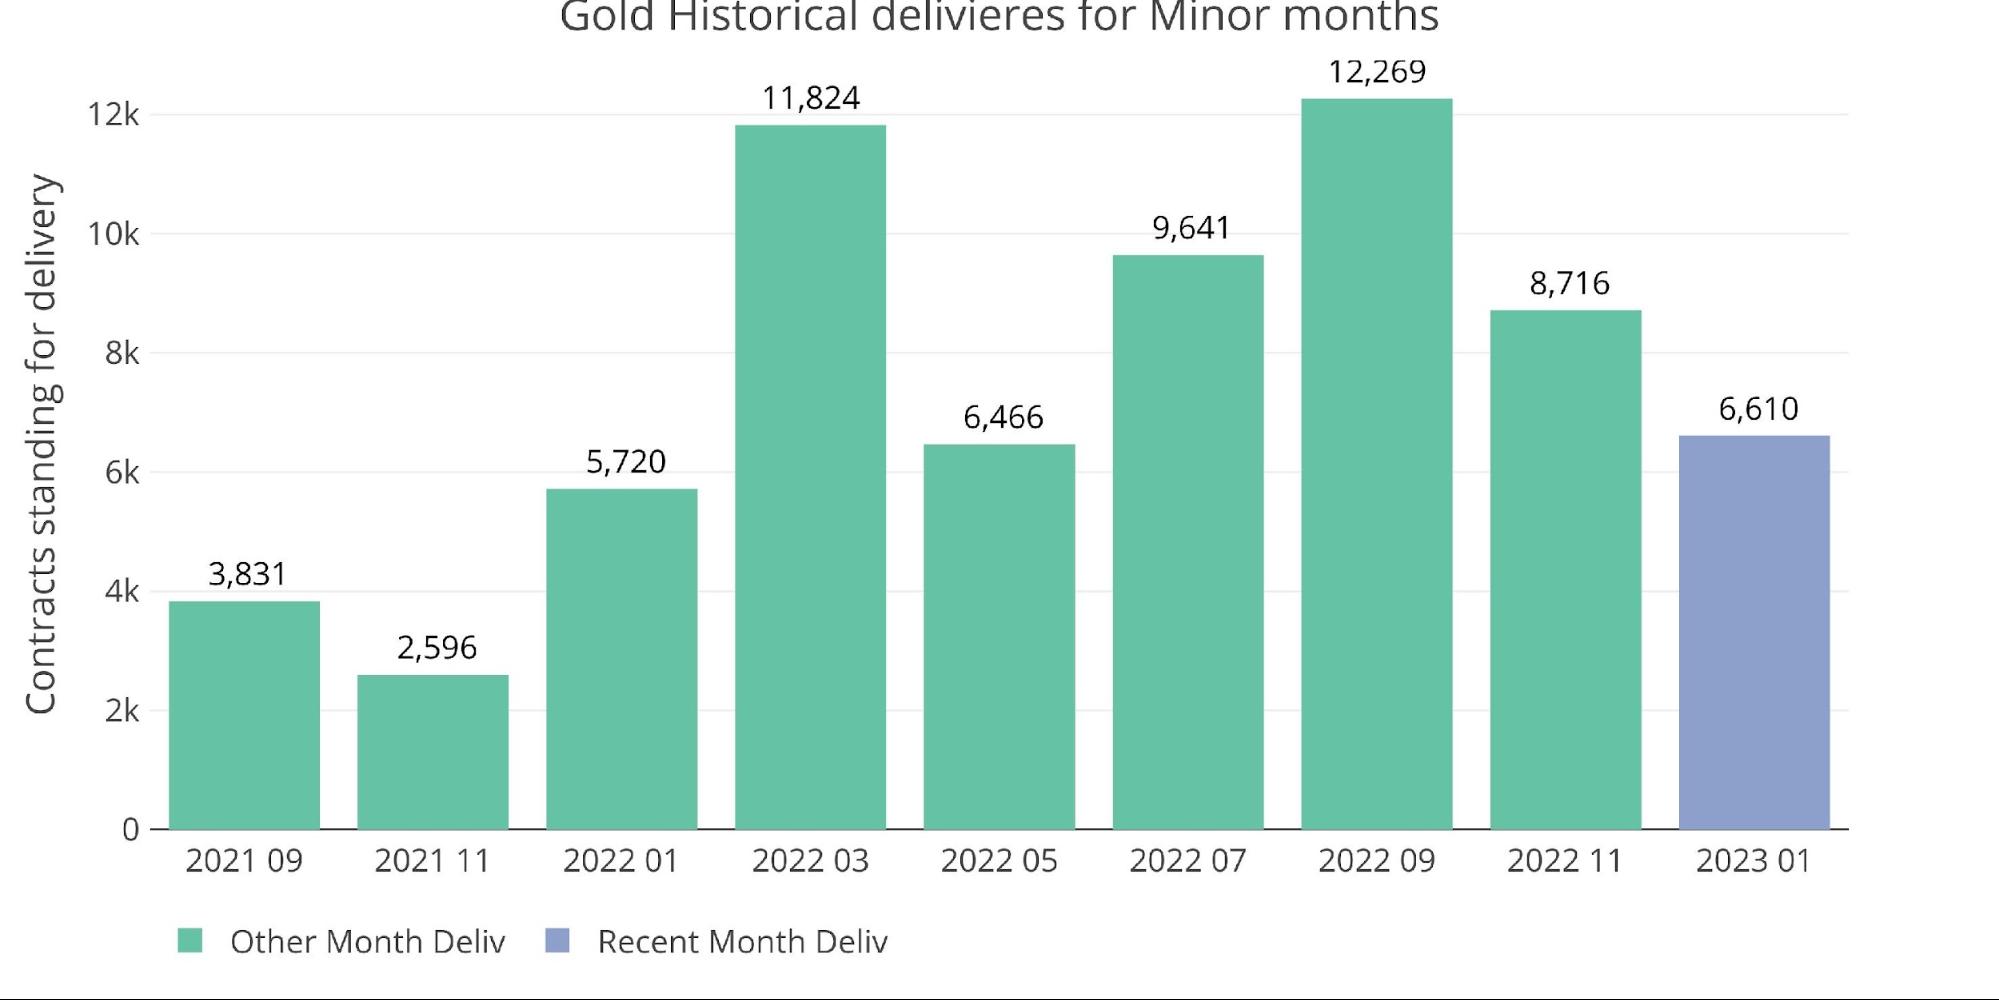
Figure: 10 Historical Deliveries
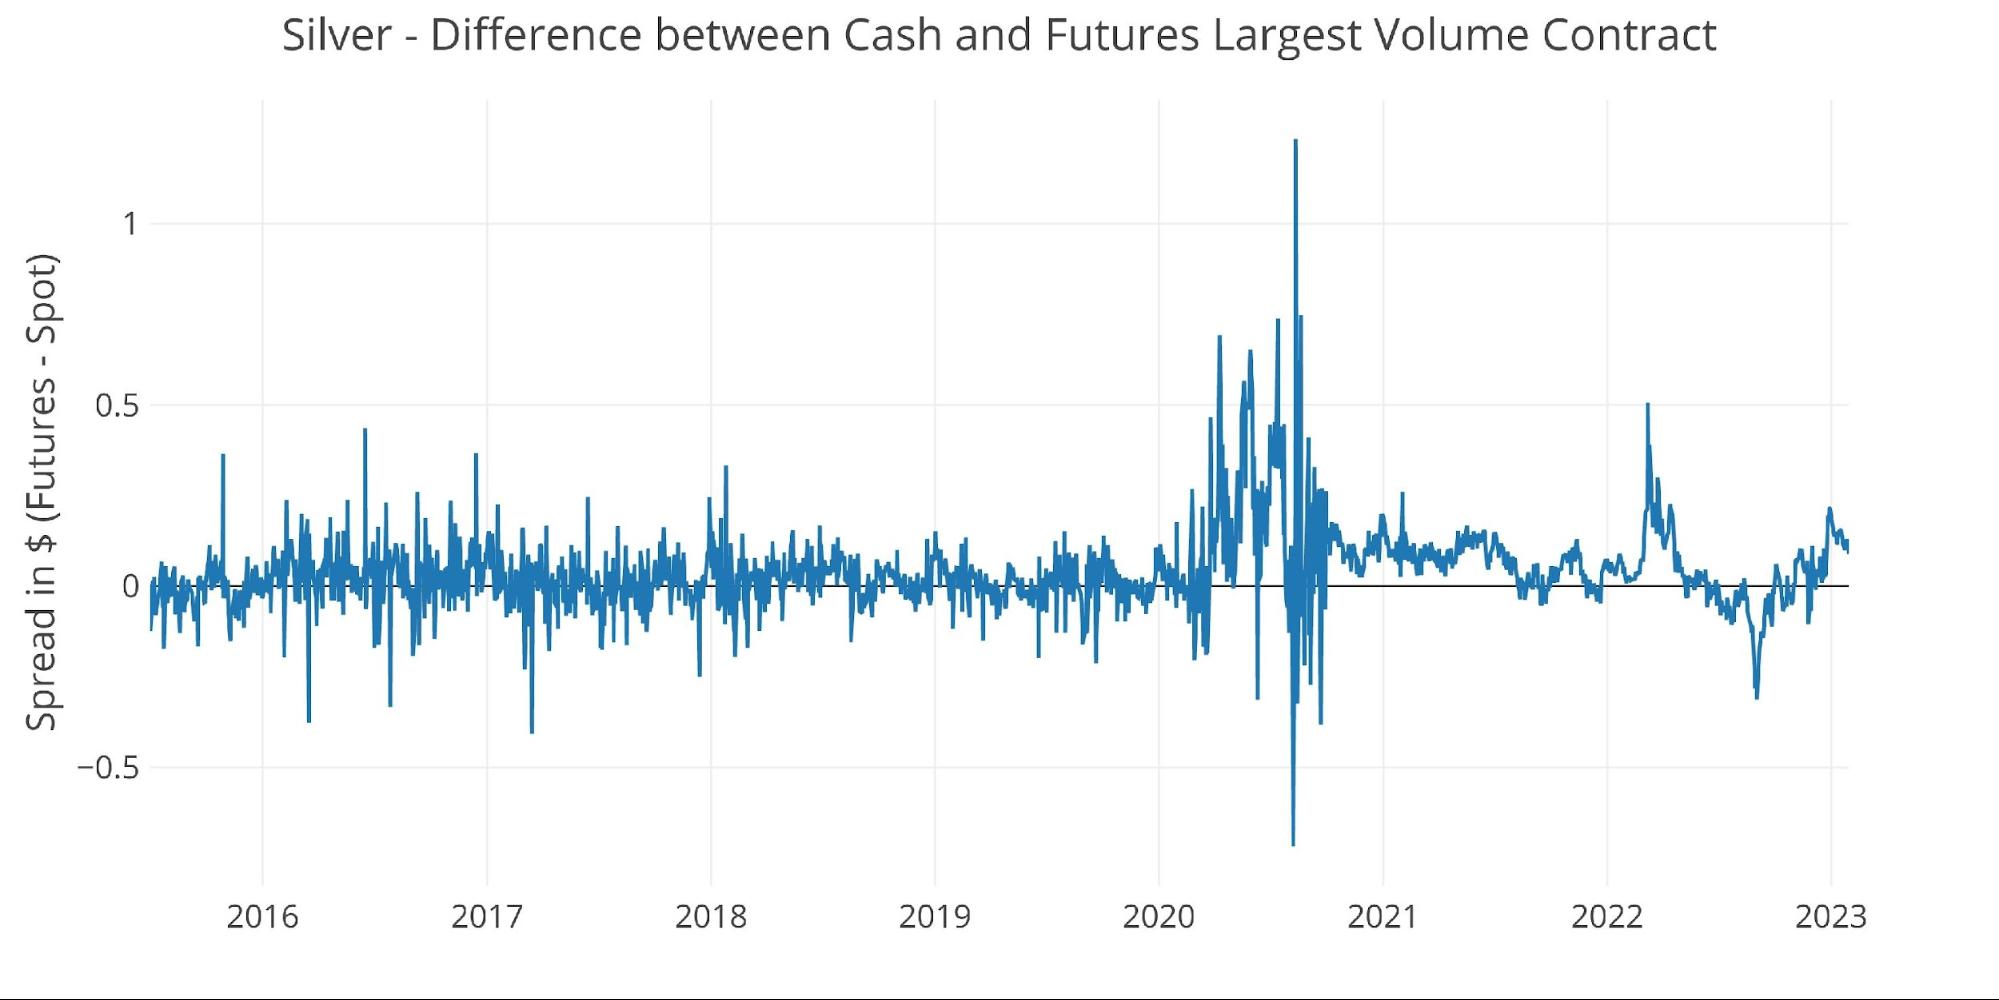
The spread in gold remains near multi-year highs after the contract rolled, but is still being managed much more efficiently than it was before the price spike back in 2020.
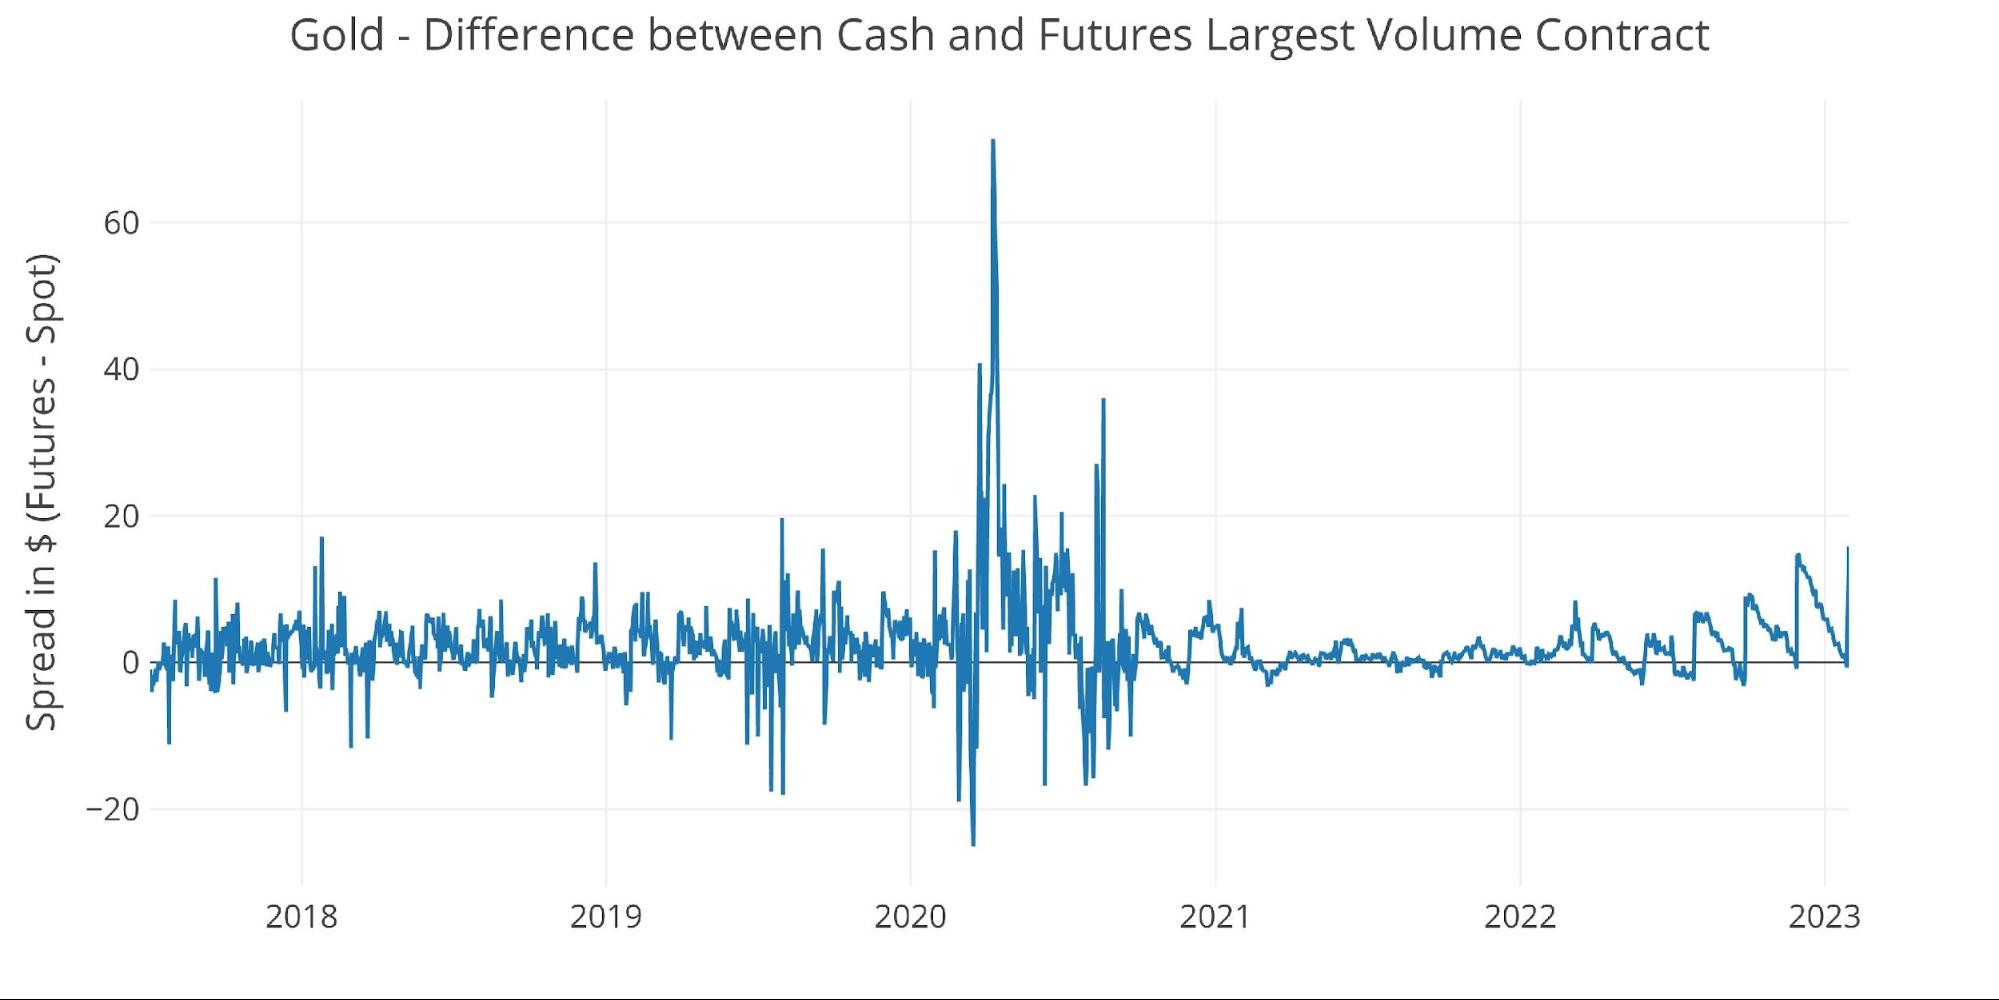
Figure: 11 Spot vs Futures
Silver: Recent Delivery Month
Delivery in silver barely has a pulse. That said, there have been some major nighttime adjustments to the preliminary and official numbers (see charts below) which does indicate stress on the system. This could be one reason deliveries have fallen off – no metal to deliver.
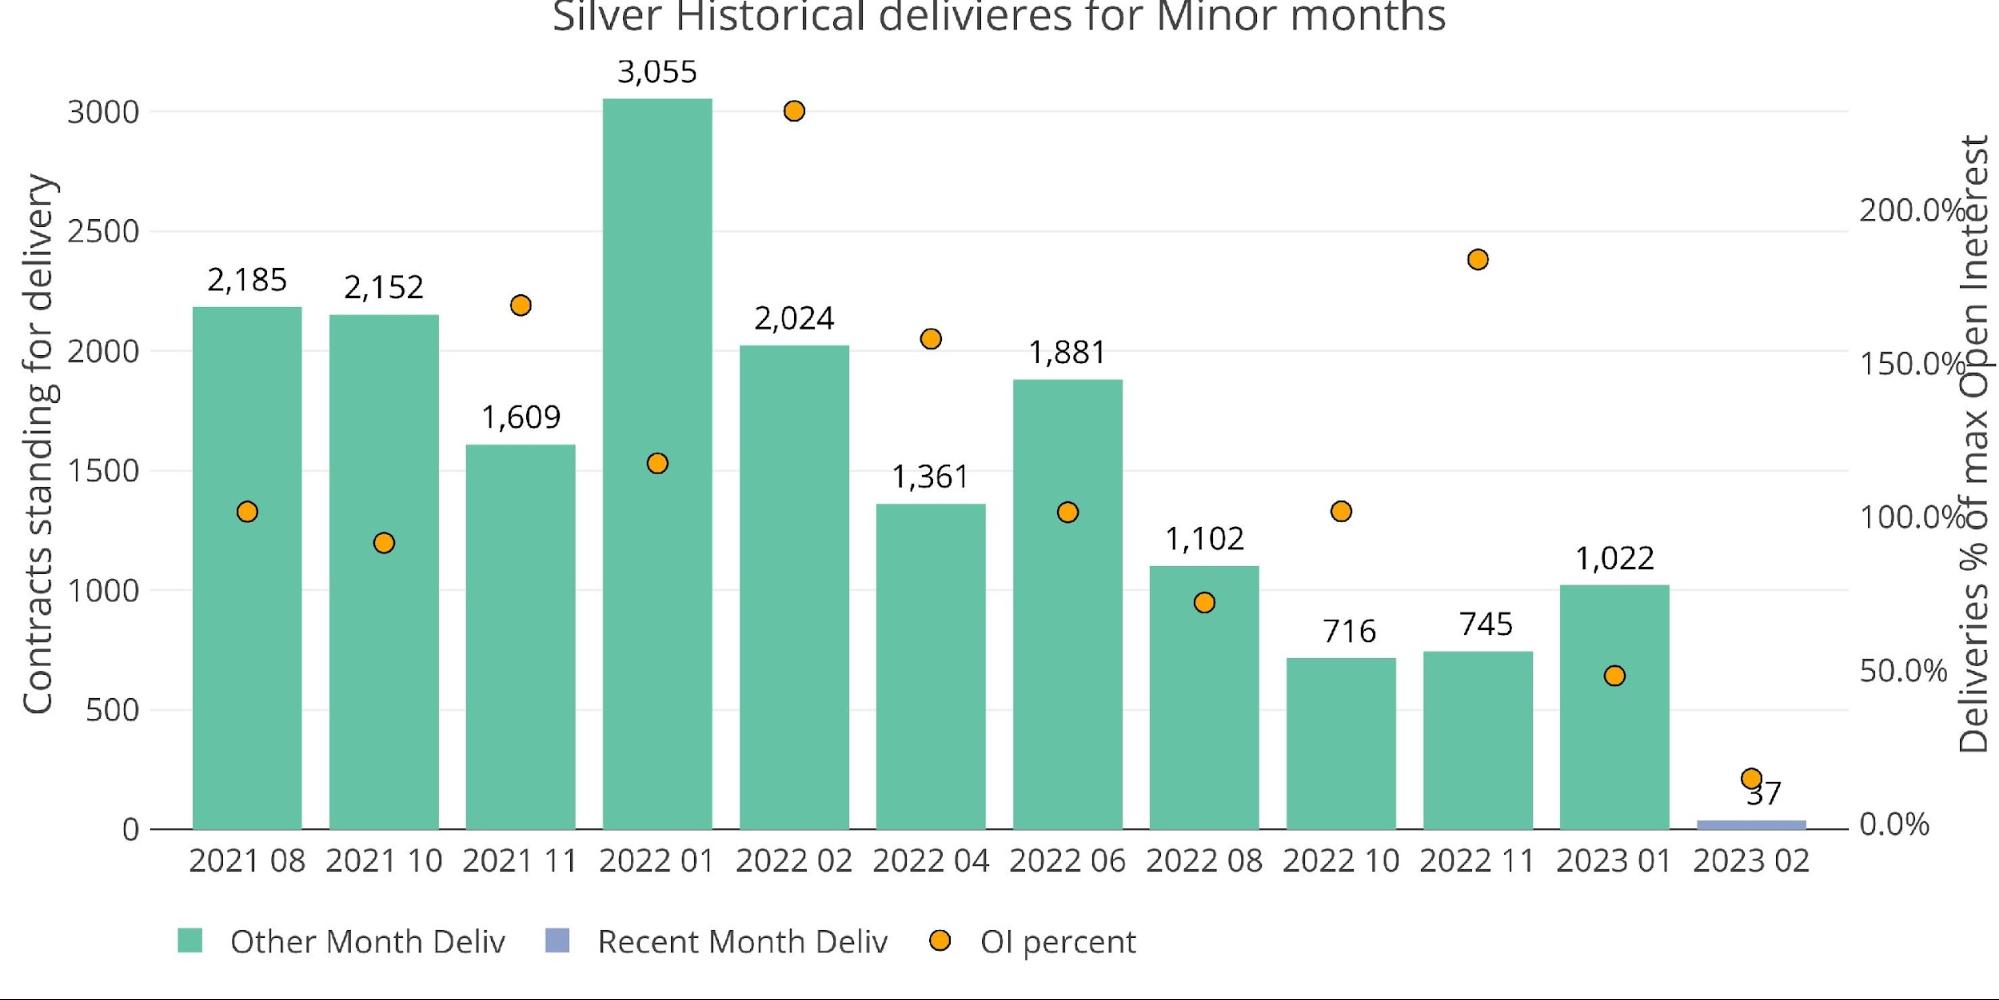
Figure: 12 Recent like-month delivery volume
Before jumping to that data, you can see how weak February looked coming into the end of the month.
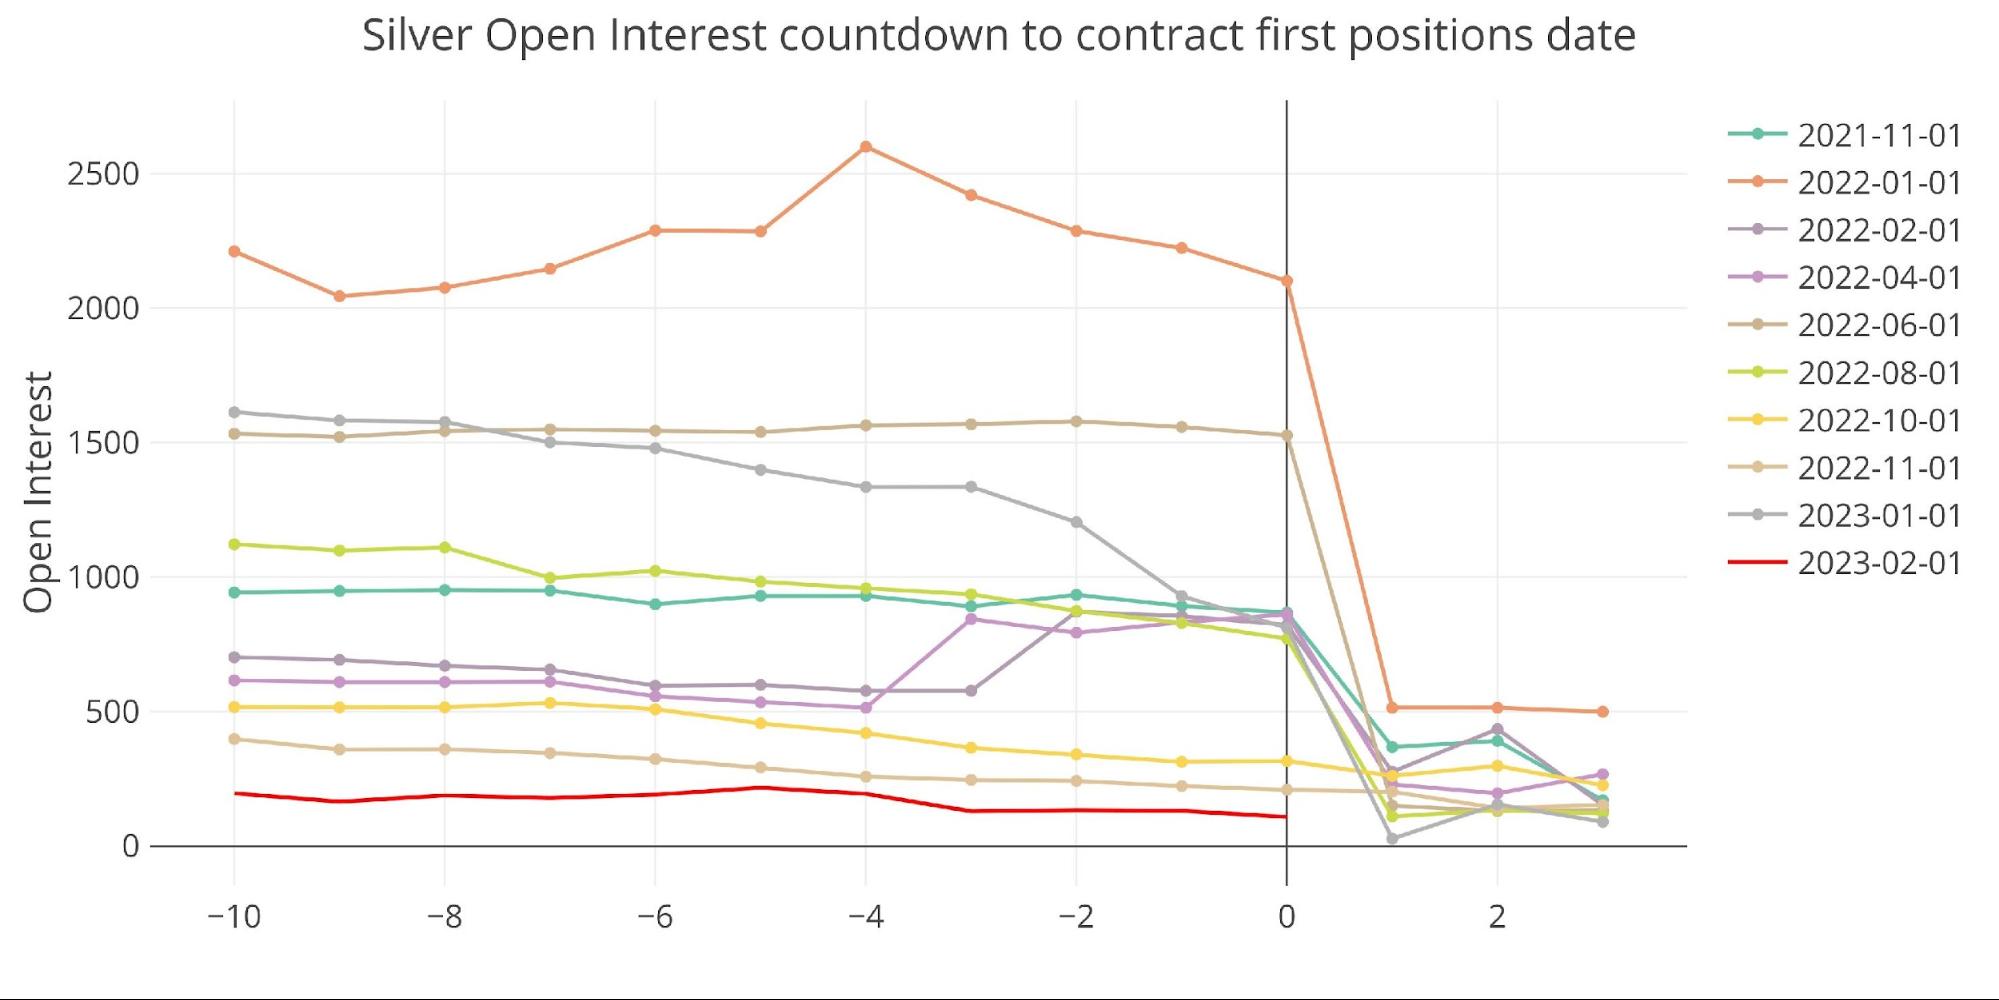
Figure: 13 Open Interest Countdown
The chart below further shows that weakness.
Figure: 14 24-month delivery and first notice
However, despite the lack of activity and weakness in delivery volume, there are still strange things afoot. This has been covered extensively on Reddit, so I won’t go into too much detail.
The cliff notes: The Comex publishes preliminary numbers the same day and then final numbers the next day. Usually, the change in the numbers is small. Below shows the percentage change in the prelim and final numbers on the final day. As shown, the recent changes have been enormous.
Speculation: someone is buying contracts and then getting cash settled out of the position before the final numbers publish. Why? I will let you explore the Reddit posts for more details! Bottom line, when prelim is more than 400% above final numbers, something is off!

Figure: 15 Prelim vs Final
The bank house accounts have not had any meaningful impact on silver this month. Same was true for 3 of the previous 4 months as well.
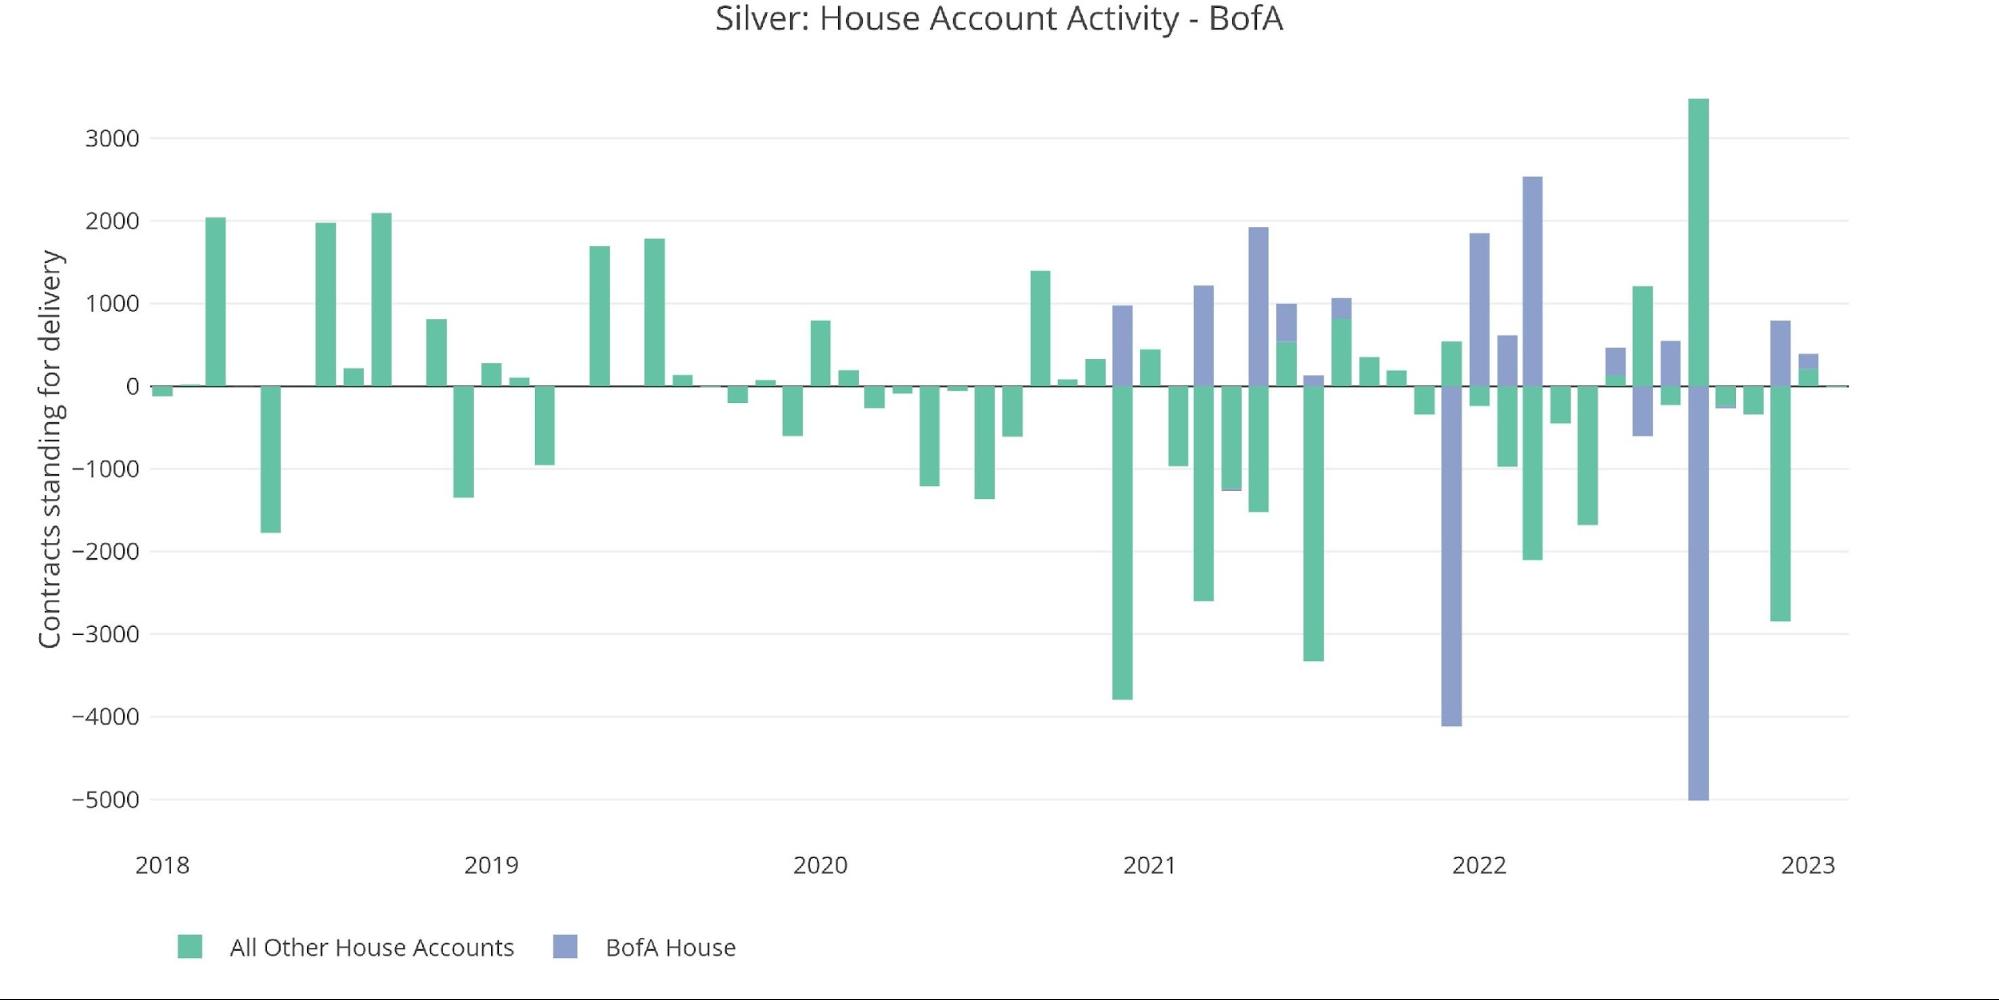
Figure: 16 House Account Activity
The outflows from Registered had come to a standstill after seeing consistent pillaging of metal for months. It will be interesting to see how this continues given the pressure that has built up.
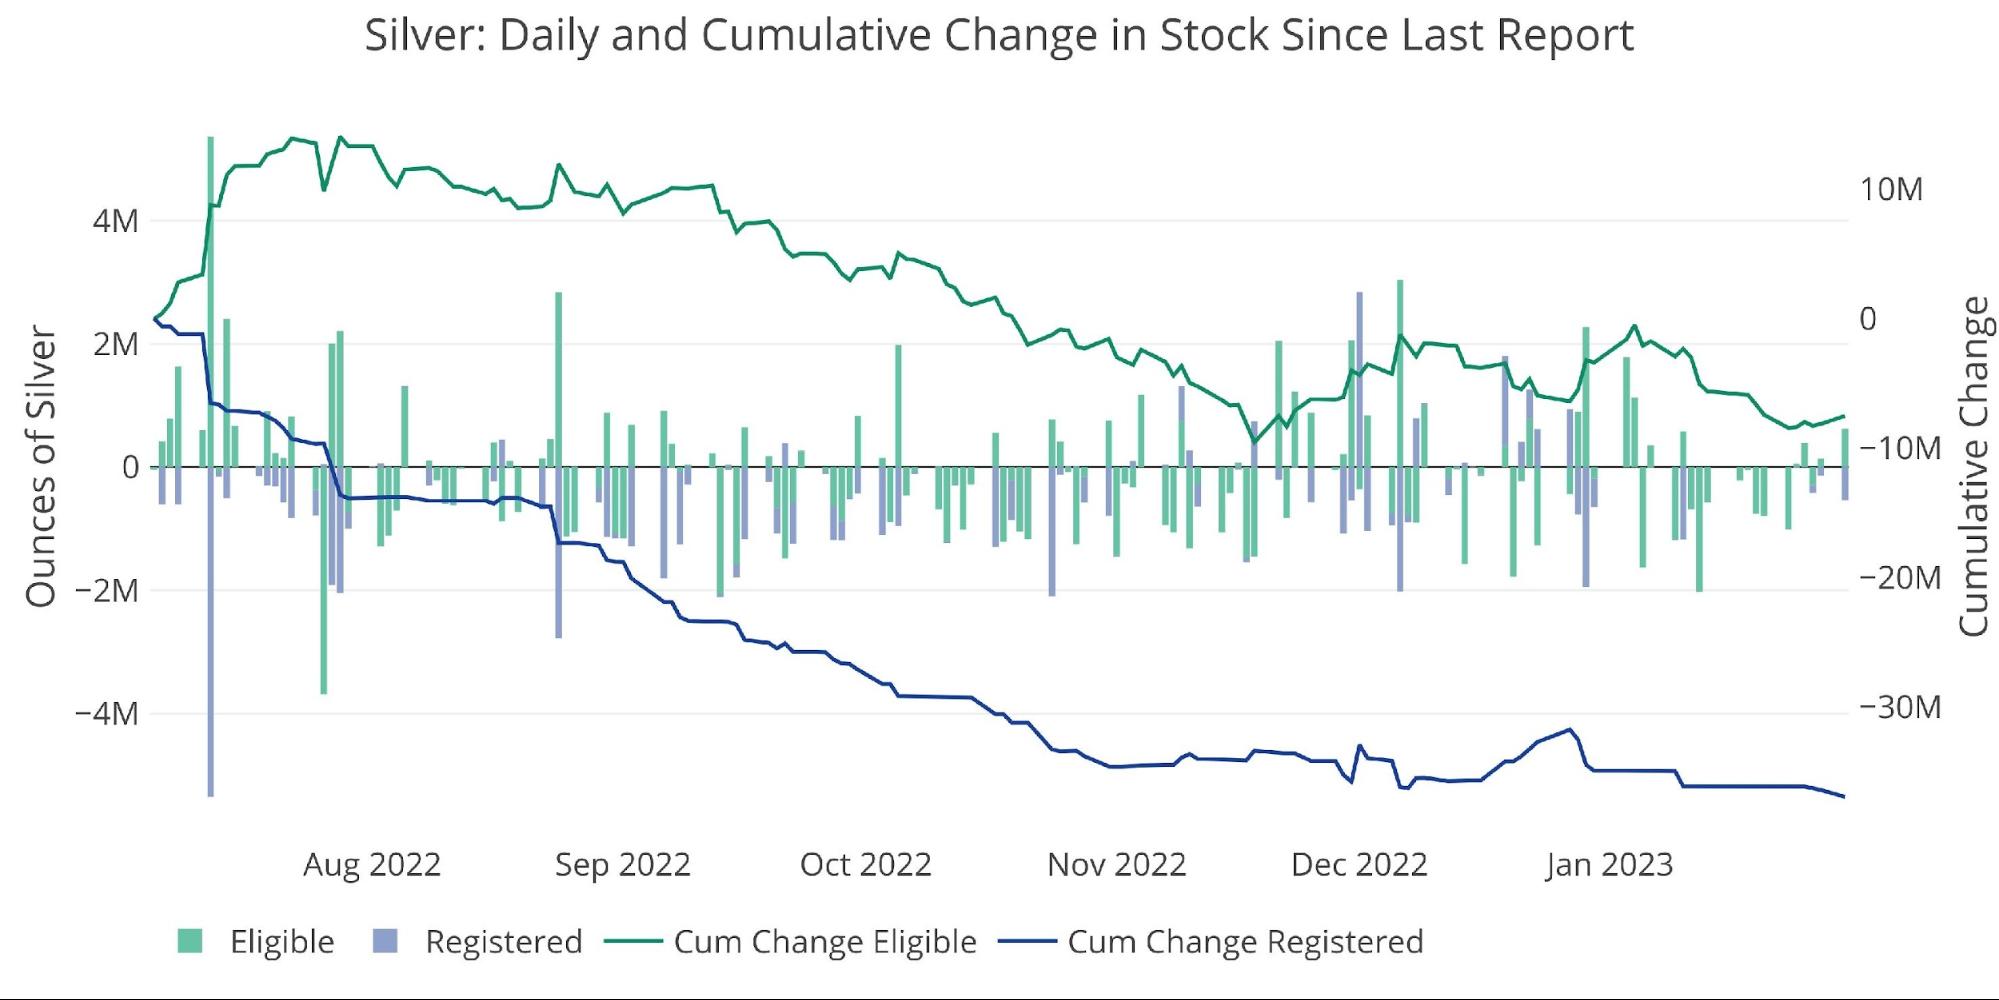
Figure: 17 Recent Monthly Stock Change
Silver: Next Delivery Month
We may find out soon, March is another major month in silver. After the stir December created, March could be interesting. While total numbers are at the bottom of the pack…
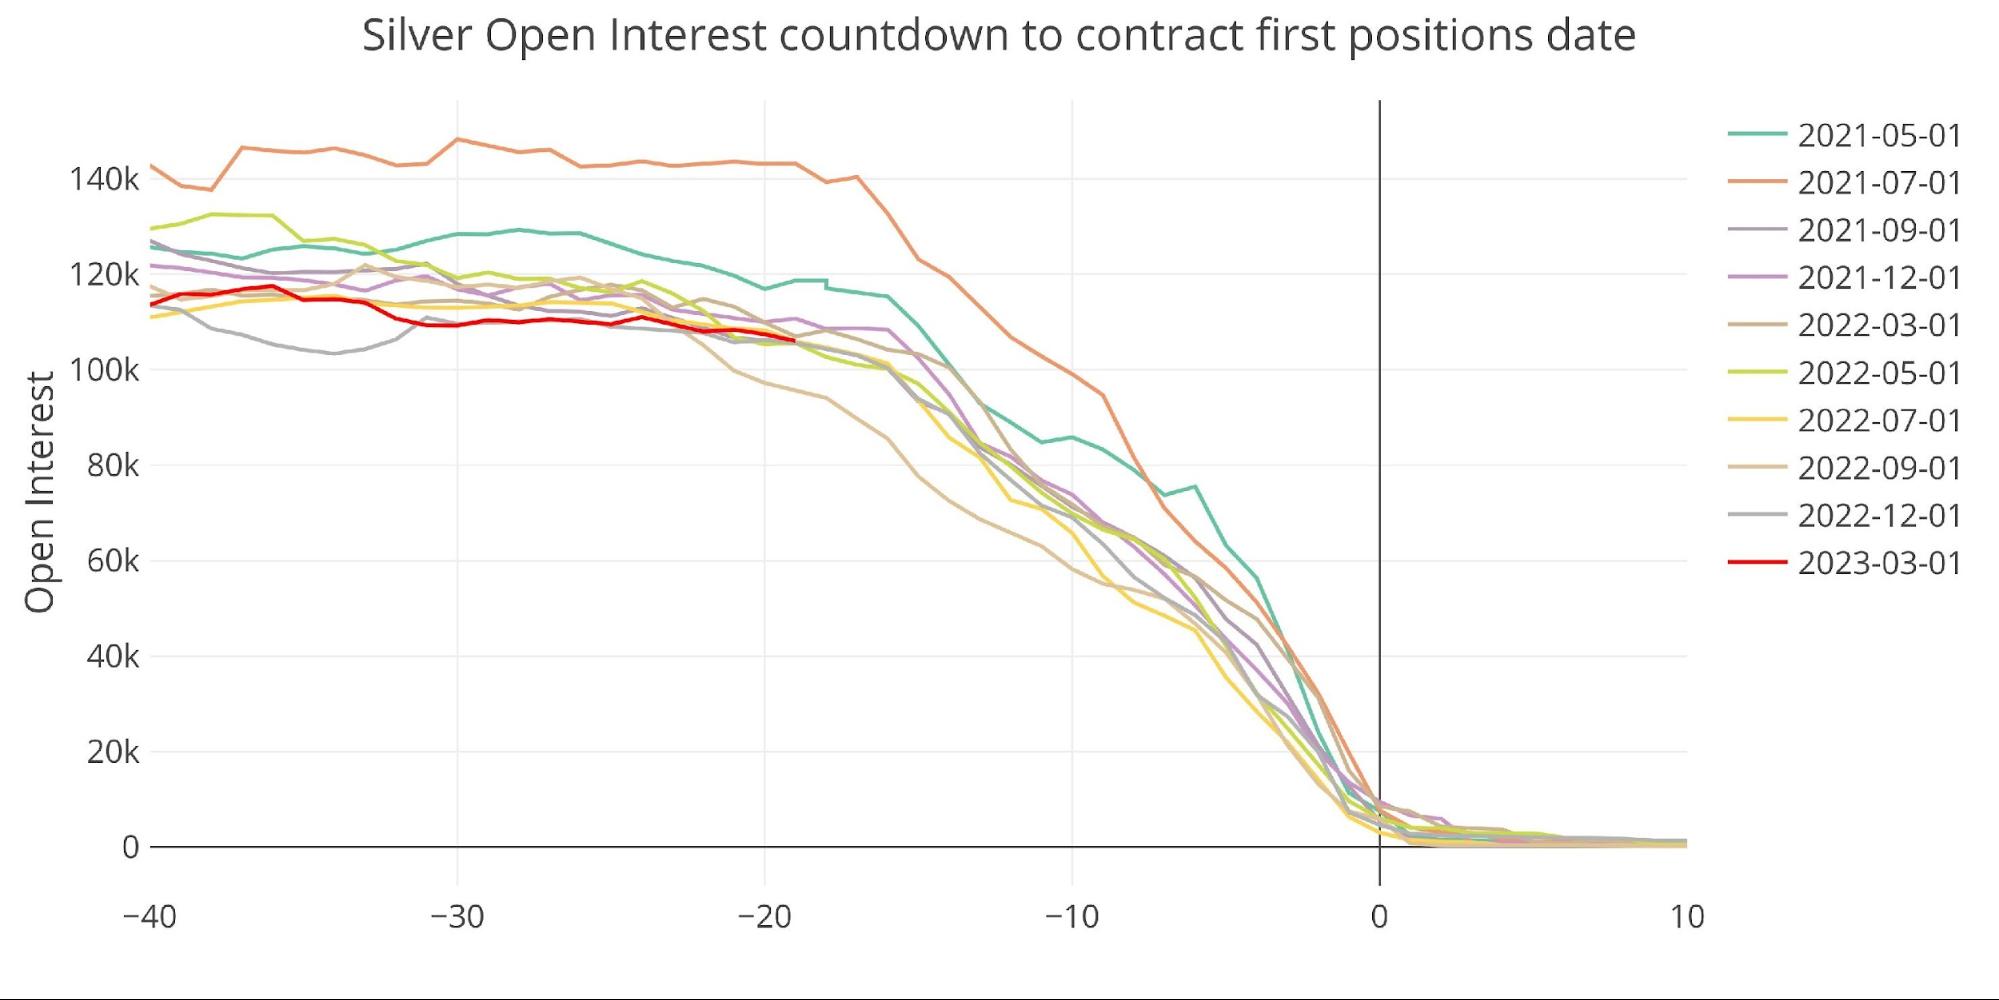
Figure: 18 Open Interest Countdown
OI as a percentage of Registered is well above the last several months.
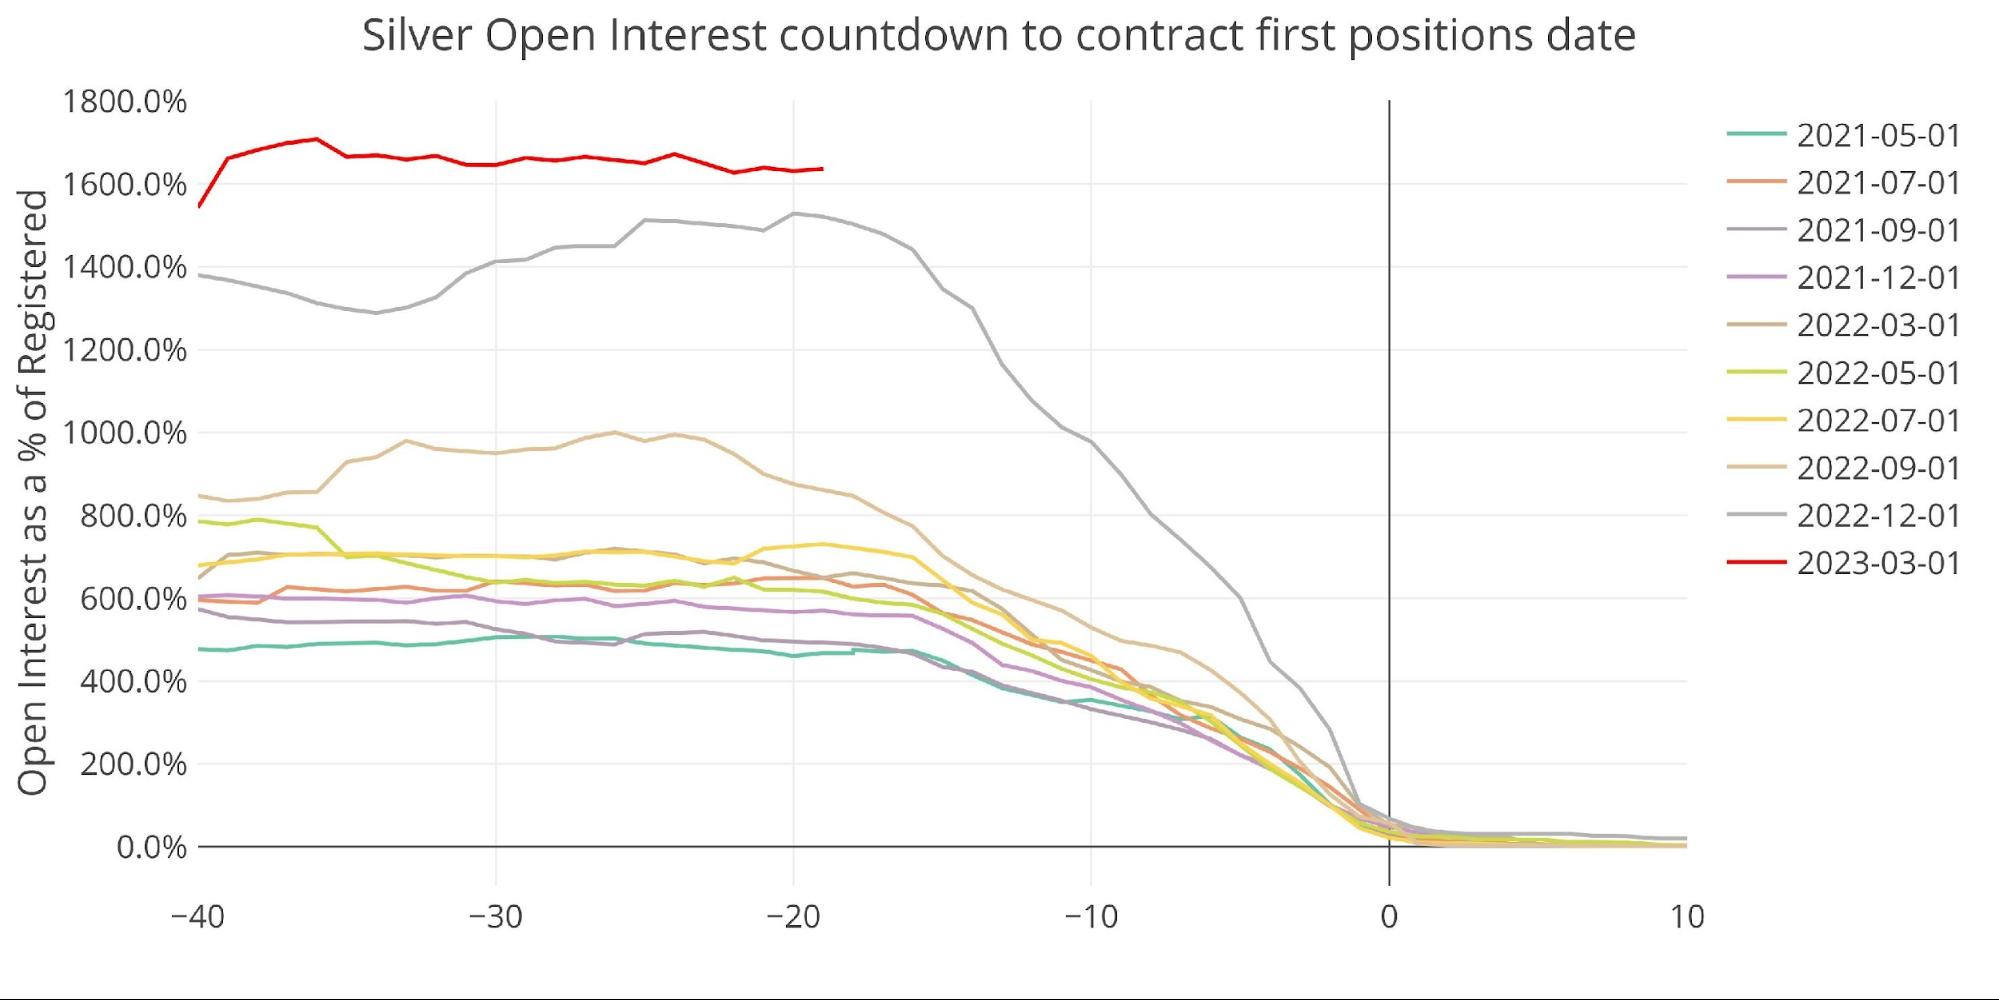
Figure: 19 Countdown Percent
If the momentum holds, March could see a large portion of Registered stand for delivery.
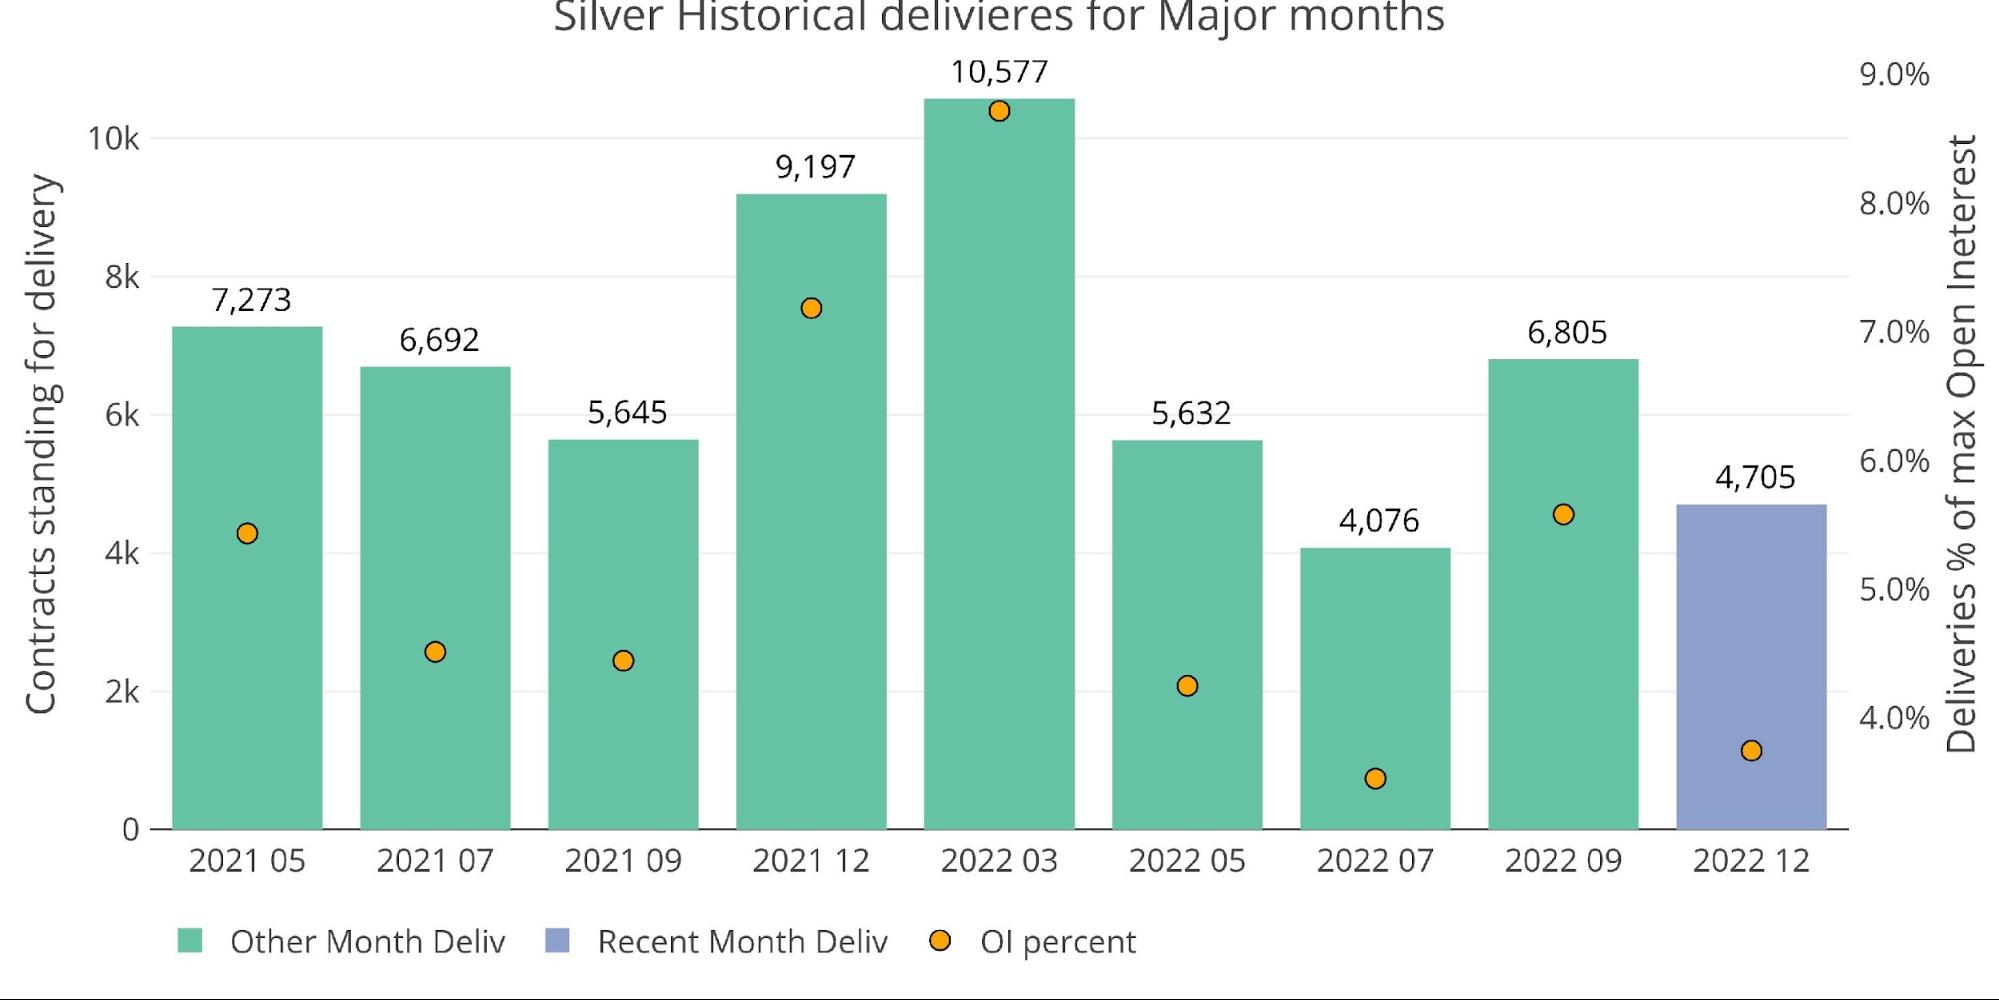
Figure: 20 Historical Deliveries
Spreads in the futures market remain elevated.

Figure: 21 Roll Cost
The spot market has dug out of backwardation but is now headed back down.
Wrapping up
The surface has been fairly calm for months with a lot going on underneath that would lead someone to believe there is pressure building in the system. The pressure has started to bubble to the surface as gold and silver both saw healthy increases over the last 6 weeks.
A pullback might be coming, but it will likely be short-lived. The indicators continue to flash. This is not something that will blow up immediately, but no doubt pressure is building. Stay tuned!
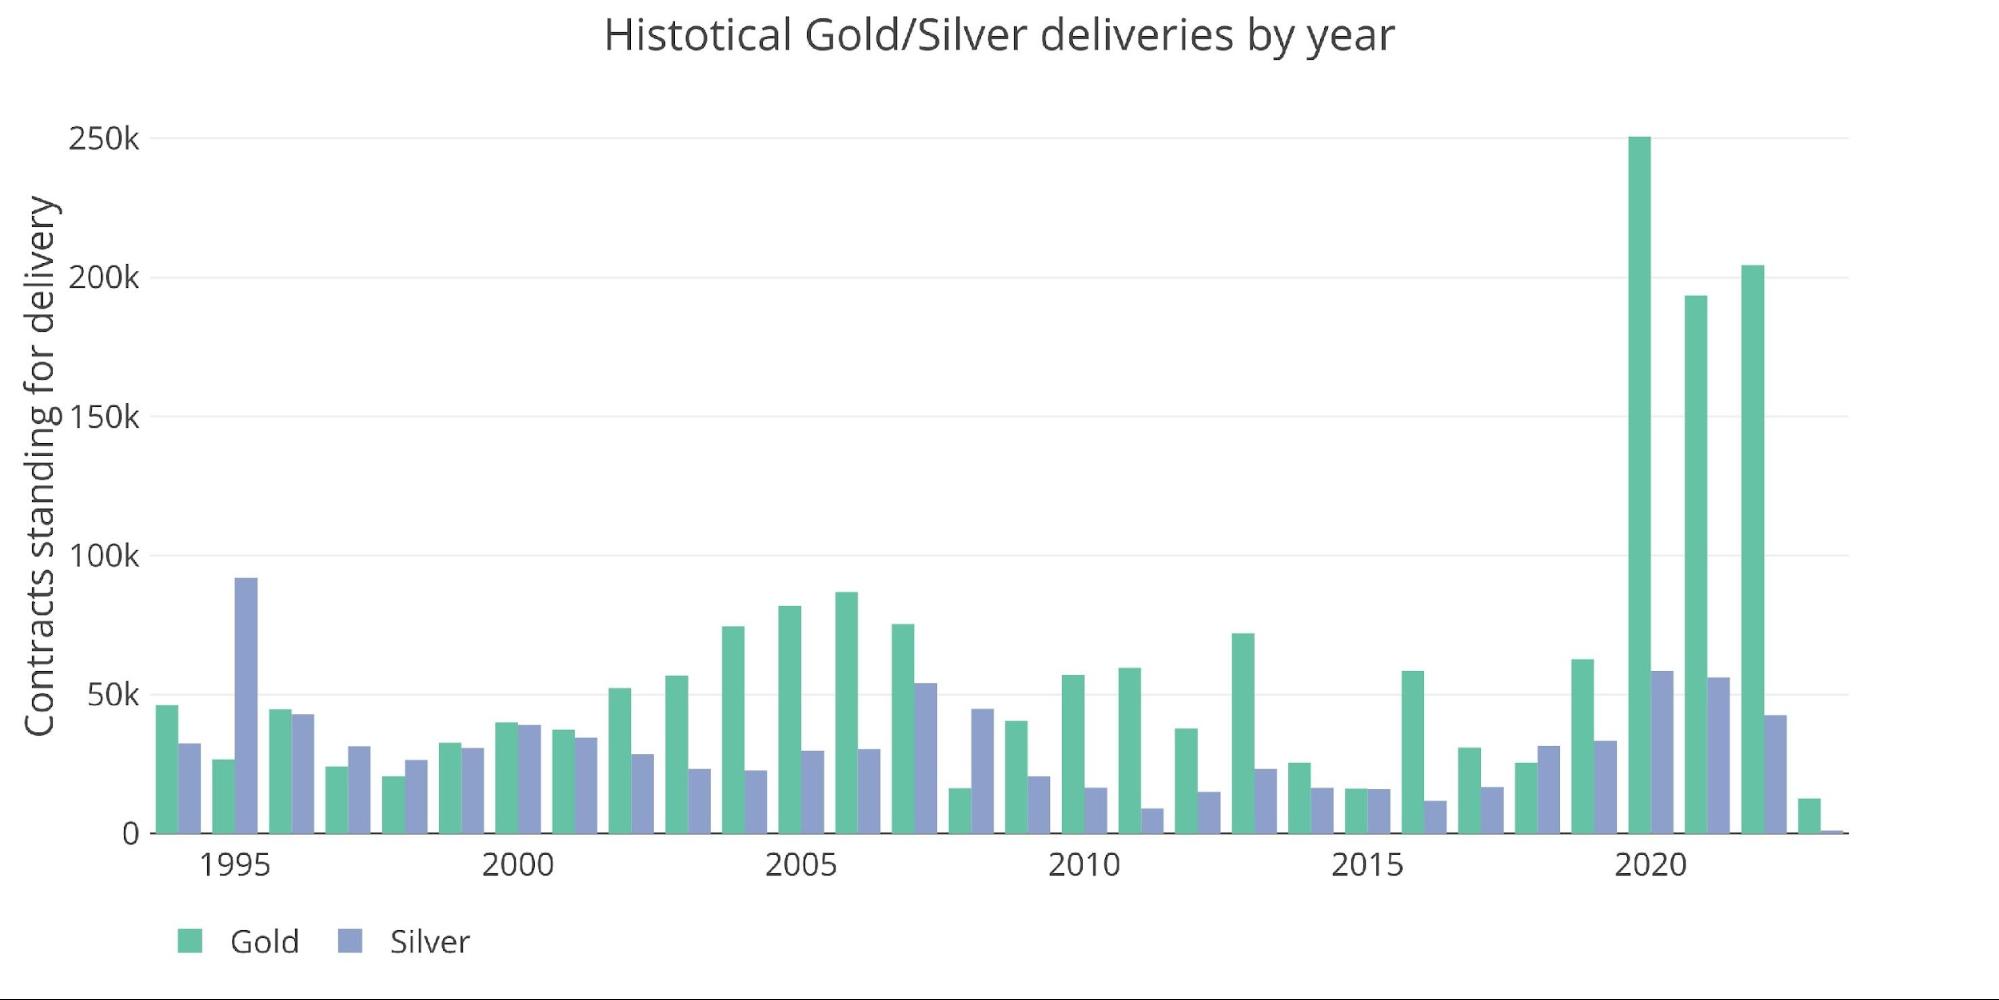
Figure: 23 Annual Deliveries
Data Source: https://www.cmegroup.com/
Data Updated: Nightly around 11 PM Eastern
Last Updated: Jan 30, 2023
Gold and Silver interactive charts and graphs can be found on the Exploring Finance dashboard: https://exploringfinance.shinyapps.io/goldsilver/

Call 1-888-GOLD-160 and speak with a Precious Metals Specialist today!
Buka akaun dagangan patuh syariah anda di Weltrade.
Source link