There is a likelihood that the pair will continue falling as bears target the next key support at 37,000.
Bearish View
- Sell the BTC/USD and set a take-profit at 37,000.
- Add a stop-loss at 40,000.
- Timeline: 1 day.
Bullish View
- Set a buy-stop at 39,000 and a take-profit at 40,500.
- Add a stop-loss at 37,000.
The BTC/USD pair declined slightly during the weekend as last week’s rally evaporated. The pair retreated to about 38,000 as investors anticipated a more hawkish Federal Reserve. It is significantly below last week’s high of over 45,000.

More Hawkish Fed
Bitcoin is a relatively risky asset, which is known for its strong volatility. For example, in a matter of three months, the currency has managed to crash from almost $70,000 to about $38,000.
One of the main reasons for this performance is the Federal Reserve, which seems to be ready for takeoff. In his testimony last week, Jerome Powell said that the bank will embrace a more hawkish tone but remain cautious. He said that the biggest challenge the bank is battling with is the rising inflation.
Data published last week showed that the American labor market did well and is not a major concern for the bank. The economy added over 600k jobs last month after adding another 467k jobs in January. At the same time, the unemployment rate has crashed to 3.8%.
On the other side of the spectrum, the country’s inflation is still surging. Data published last month revealed that the economy’s inflation rose to 7.5%. Now, with a crisis happening in Ukraine, the situation will likely get worse because of the worse supply chains.
Oil and gas prices have risen to multi-year highs. The same is true with other essential commodities like copper, wheat, and iron ore. The US will publish the latest inflation data later this week.
The BTC/USD pair decline has also mirrored the performance of other assets like stocks. On Friday, the Dow Jones, Nasdaq 100, and S&P 500 indices crashed by over 50 basis points as the crisis in Ukraine accelerated.
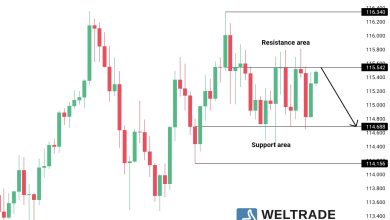
BTC/USD Forecast
The four-hour chart shows that the BTC/USD pair formed a bearish flag pattern during the weekend. In price action analysis, this pattern is usually a bearish sign. It then made a bearish breakout as worries about the Fed rose.
It has managed to move below the 25-day and 50-day moving averages while oscillators like the Relative Strength Index (RSI) has moved to the oversold level. The pair also moved below the 38.2% Fibonacci retracement level. Therefore, there is a likelihood that the pair will continue falling as bears target the next key support at 37,000.

Source link