While the overall trend is bullish, a drop to the lower side of the ascending channel at $20 cannot be ruled out.
Bearish View
- Sell the DOT/USD pair and set a take-profit at 20.
- Add a stop-loss at 23.0.
- Timeline: 1-2 days.
Bullish View
- Set a buy-stop at 22.50 and set a take-profit at 23.50.
- Add a stop-loss at 21.00.
The Polkadot (DOT/USD) price retreated slightly on Tuesday as the strong recovery rally faltered. The coin is trading at $21.73, which is a few points below the intraday high of $23.15. Still, the price is about 37% above the lowest level this year.

Polkadot Rally Pauses
Like most altcoins, Polkadot has been in a strong bullish trend in the past few weeks. After crashing to a low of $15.80 in January, the coin has risen by about 37%.
This recovery is mostly because of the performance of Bitcoin, which has risen from less than $30,000 to today’s $42,000. Historically, altcoin prices tend to move in the same direction as Bitcoin.
In the past few weeks, sentiment in the market has improved. The tech-heavy Nasdaq 100 index has jumped from its lowest level this year as investors buy the dips.
Another sign that the market mood has improved is the performance of the VIX index. Its price has declined by more than 7% from its highest level this month as volatility declines. Similarly, investors are getting more greedy as evidenced by the performance of the fear and greed index.
Meanwhile, on-chain data shows that activity in Polkadot’s ecosystem has been relatively strong recently. According to DeFi Llama, the ecosystem has a total value locked of more than $1.5 billion.
Still, the ecosystem has a long way to go considering that it completed its parachain auctions recently. In A report this week, Polkadot said that it will allocate $21 million to grow its ecosystem.
The next major catalyst for the Polkadot price will be the upcoming US consumer inflation data. Analysts expect that the data will show that inflation rose to the highest level in more than 40 years in January. These numbers will help to determine the pace of Fed’s rate hikes.
Polkadot Price Prediction
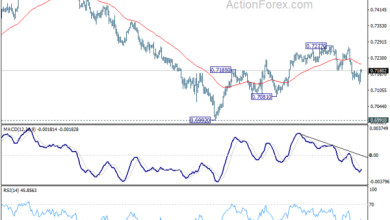
The four-hour chart shows that the DOT/USD pair has been in a strong bullish trend in the past few weeks. As a result, the pair formed an ascending channel that is shown in red. The price is currently slightly below the upper side of this channel. It has also moved slightly above the 38.2% Fibonacci retracement level. The pair is slightly above the 25-day and 50-day moving averages.
Therefore, while the overall trend is bullish, a drop to the lower side of the ascending channel at $20 cannot be ruled out.

Source link