
The Treasury ran a budget deficit of $193B in the month of March. This exceeded the 12-month average of $144B.
Over the last year, the Treasury has seen a massive influx of Individual tax revenues that have helped support the ballooning Federal Deficit. Unfortunately, spending has been so high that the additional revenue did not give much reprieve, causing the Treasury to borrow $2.27T over the last 12 months.
April will generally see a surge in tax revenues since April 15 is the tax filing deadline. It will be interesting to see if this trend holds or if refunds will overwhelm revenue. Considering the massive backlog, it may take a few months for the data to flush out.
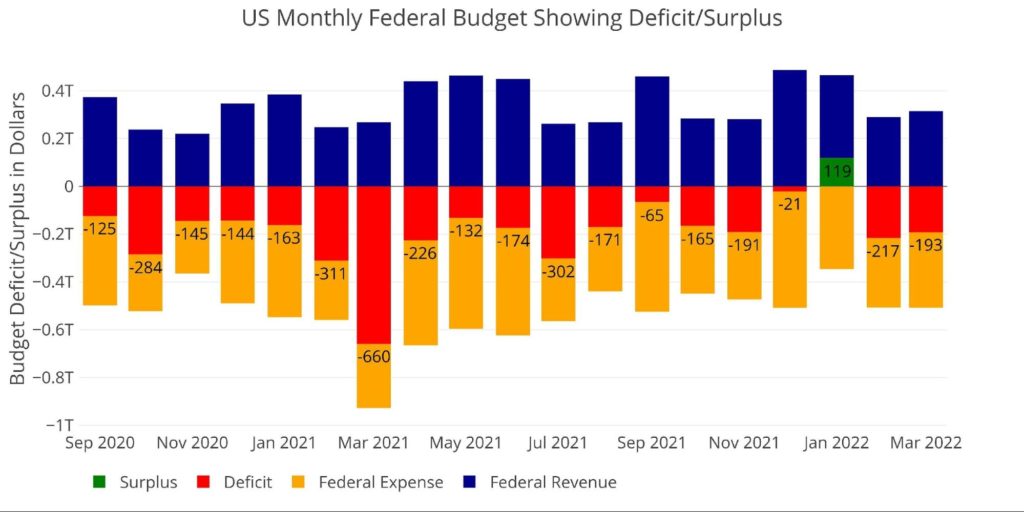
Figure: 1 Monthly Federal Budget
The Sankey diagram below provides a look at spending and revenue. The deficit represented 37.7% of total spending which means that revenue only covered 62.3% of total expenditures. The full deficit represented nearly all of Income Security and Social Security combined!

Figure: 2 Monthly Federal Budget Sankey
Comparing the monthly (above) to the yearly (below) shows that the current monthly deficit is actually larger than the TTM deficit on a relative basis (37.7% vs 28%). Individual taxes were noticeably smaller in the current month, representing ~30% of total revenue vs 37.8% for the TTM.
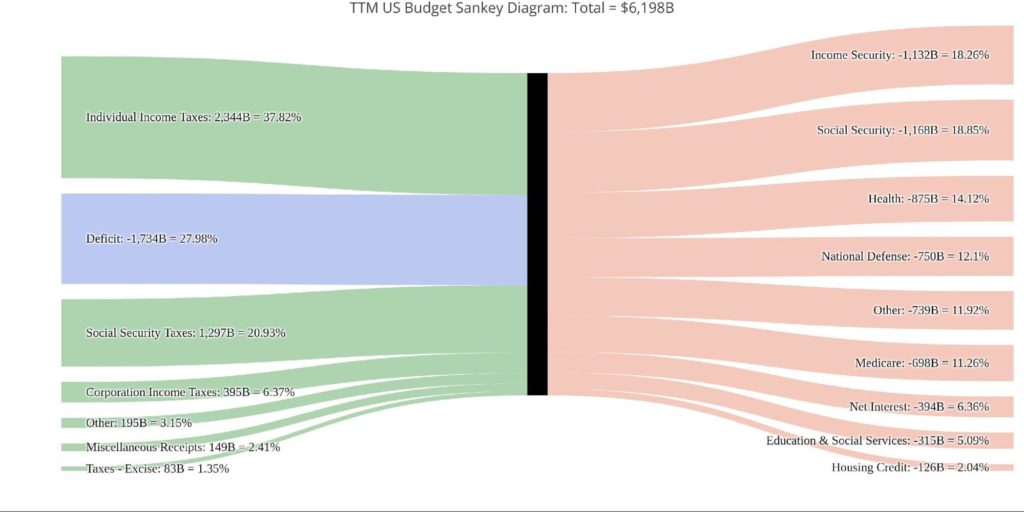
Figure: 3 TTM Federal Budget Sankey
Figure 4 below, expands on the revenue side of Figure 1 above. Individual tax revenue has almost doubled for the month of March when compared to previous years. The past 5 years show March Individual tax revenue:
- 2018: $88B
- 2019: $97B
- 2020: $98B
- 2021: $120B
- 2022: $150B
The Treasury does not provide much detail beyond these numbers, so it’s hard to know if it’s being driven by higher wages, capital gains, or something else. Regardless, the surge is very noticeable. Next month should give a good indication of just how much benefit the Treasury will gain from the increased revenues.
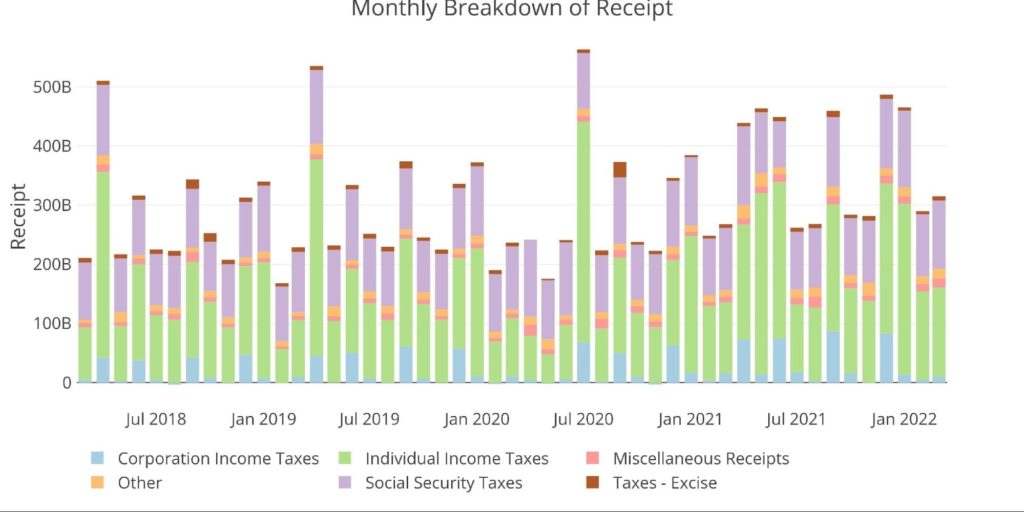
Figure: 4 Monthly Receipts
The expense side is a bit steadier month over month. The Treasury has found a zone of spending around $500B a month (a casual $6T a year) across a range of services.
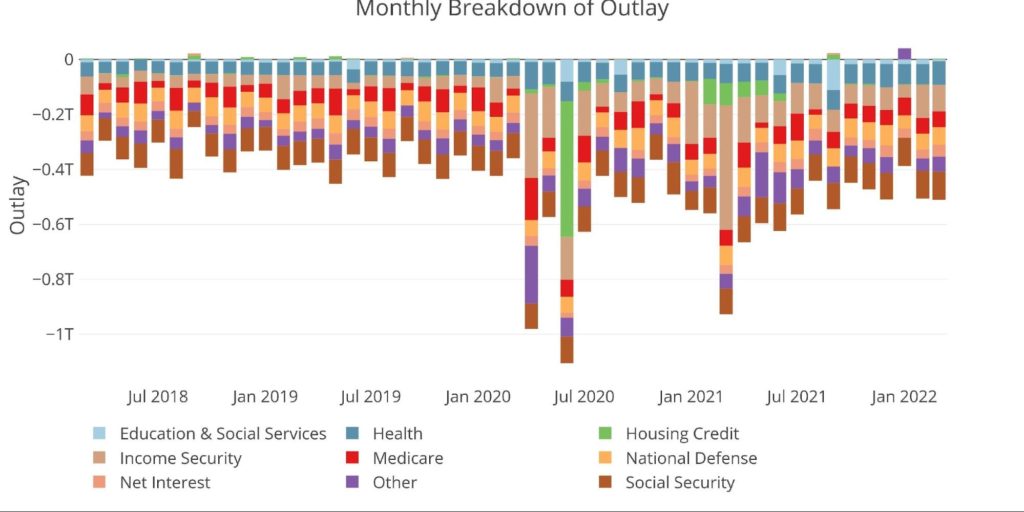
Figure: 5 Monthly Outlays
The table below goes deeper into the numbers of each category. The key takeaways from the charts and table:
Outlays
- Debt Interest is up $12B or 38% compared to March last year and up 10% on the TTM average
- YoY this is the fastest-growing spending category
- As the Covid stimulus measures fall further into the past, YoY spending continues to drop
- Income Security has fallen almost $350B or close to 80% compared to March of last year
- On a TTM, Income Security is down 42.8% compared to last March, but up 118% compared to TTM ending March 2020
- Spending on Health and Social Security continue to climb MoM, YoY, and TTM
Receipts
- TTM Individual Taxes are up 25% YoY but actually down 23% when compared to the TTM Average
- On a TTM YoY Basis, Income Taxes are up over 40%
- TTM Corporate Taxes ($394B) are up 70% compared to last March ($234B) and 60% compared to March 2020 ($246B)
Total
- Total Receipts are up more than $940B (26.8%) in a single year!
- TTM Outlays are down 18.6% as stimulus has come to an end, but are still up 35% or $1.6T from pre-Covid levels
- The TTM deficit of $1.7T is 57% smaller than the $4T from last March
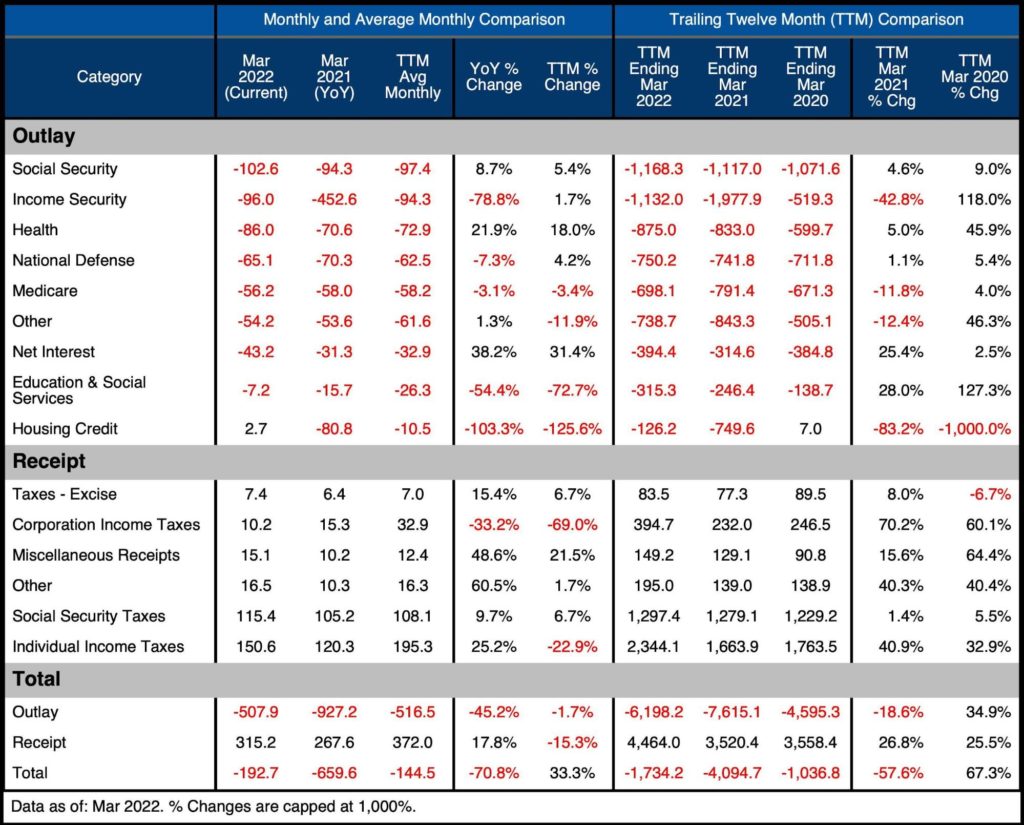
Figure: 6 US Budget Detail
Historical Perspective
Zooming out and looking over the history of the budget back to 2007 shows how extreme the last two years have been. The chart below shows the data on a TTM basis to smooth out the lines.
As can be seen on the far right, Expenses have fallen rapidly even while receipts continue to move up. It’s hard to imagine this trend will continue given a looming recession and rapidly rising rates. A recession would cause revenues to fall and spending to increase, while rising rates will increase the cost of the federal debt.
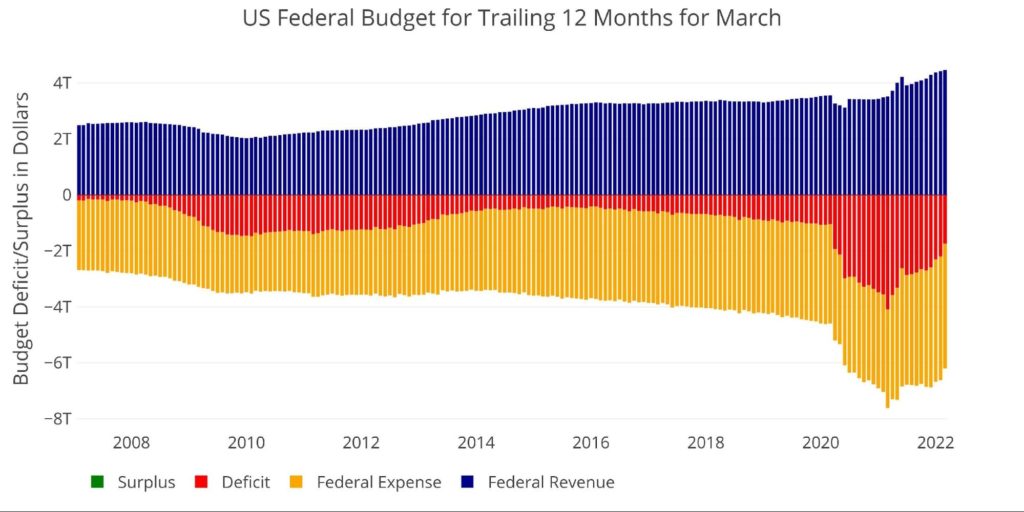
Figure: 7 Trailing 12 Months (TTM)
The next two charts zoom in on the recent periods to show the change when compared to pre-Covid. Once again, the surge in Individual and Corporate Taxes has become very clear. The last 12 months have produced revenues well above the previous 6 years. Can this trend hold?
The revenue surge is most likely a delayed effect of the massive federal spending seen. As the stimulus checks dry up, it will be hard for the government to keep tax receipts elevated.
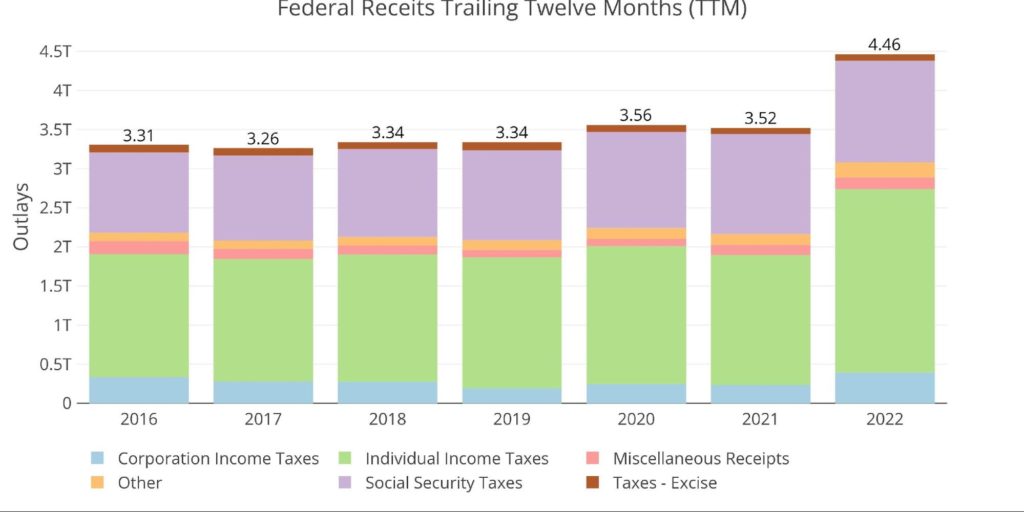
Figure: 8 Annual Federal Receipts
The expense side also shows an improving picture. But again, will it last? It’s unlikely that spending will get back to pre-pandemic levels. Not to mention, pre-pandemic spending was still unsustainable.
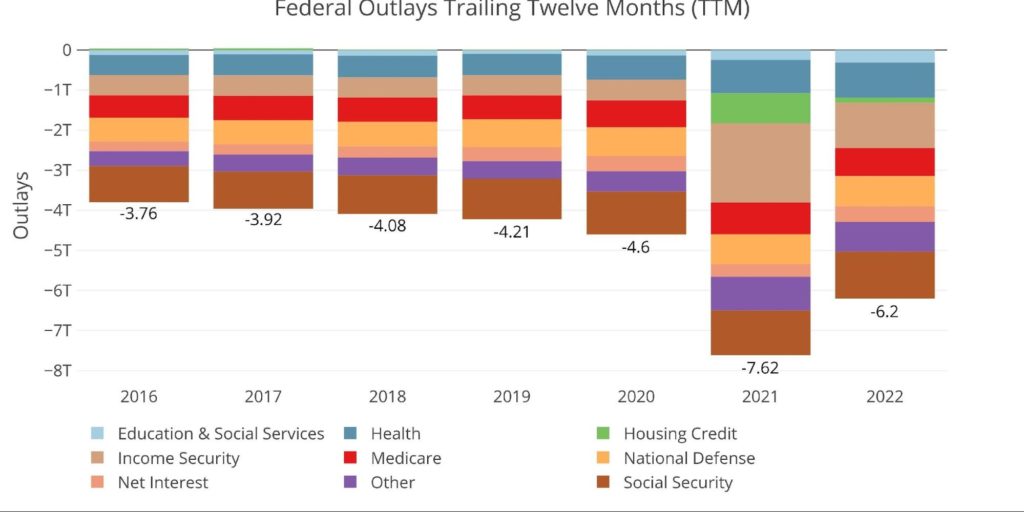
Figure: 9 Annual Federal Expenses
With surging tax revenues and a decrease in spending when compared to the last two years, the deficit will shrink. That does not mean everything is okay. Before Covid, the TTM deficit compared to GDP had been trending up towards 5% before exploding to 18.6%. It has since come down to 7.2% very rapidly. It may come down a bit more in the months ahead, but will almost certainly climb back upwards as stimulus fully wears off.
Note: GDP Axis is set to log scale
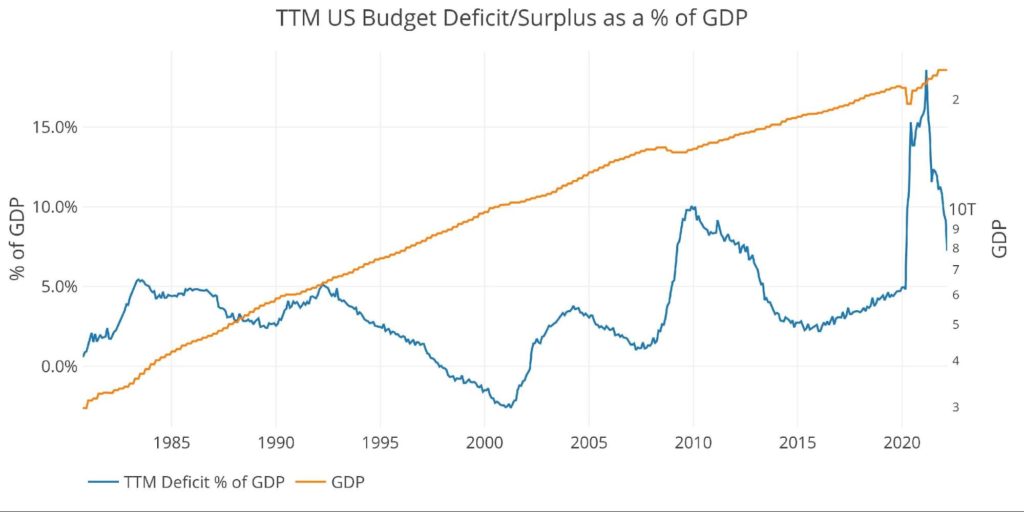
Figure: 10 TTM vs GDP
Finally, to compare the calendar year with previous calendar years, the plot below shows the YTD figures through March. The surge in revenues is again very noticeable. This has caused the budget deficit to come in below where it has been in many years past as shown by the red bar.
For example, by March 2018 and 2019, the budget deficit was $374B and $372B vs “only” $290B in the current year.
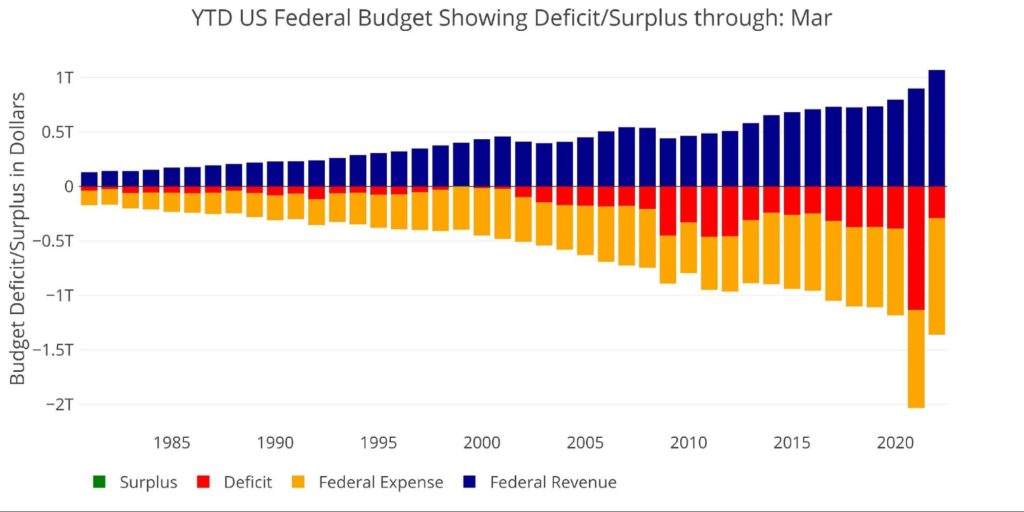
Figure: 11 Year to Date
What it means for Gold and Silver
Based on the current data, the budget deficit does look to be in better shape when compared to the last several years, even pre-pandemic. Next month will be a true indicator of how well this year is playing out since April tends to be the biggest revenue month of the year for the Treasury. Will they owe greater refunds than in years past?
Regardless, the Federal government is still miles away from a budget surplus. Furthermore, a recession and rising rates could both prove very challenging for the Federal Deficit. The Treasury is probably enjoying a reprieve that will soon end. With rising rates, the tax revenues will get sucked up into interest payments.
How long until the Fed has to reverse course and support the Federal Deficit? Right now, the path looks okay, but that could change very quickly. Gold and silver will provide ultimate protection when the deficits begin exploding again and the Fed capitulates.
Note: Everything is relative. A $290B deficit through March is still extremely large by historic standards. It is, however, also smaller than what many would have expected.
Data Source: Monthly Treasury Statement
Data Updated: Monthly on eighth business day
Last Updated: Period ending Mar 2022
US Debt interactive charts and graphs can always be found on the Exploring Finance dashboard: https://exploringfinance.shinyapps.io/USDebt/

Call 1-888-GOLD-160 and speak with a Precious Metals Specialist today!
Buka akaun dagangan patuh syariah anda di Weltrade.
Source link