The July Trade Deficit fell for a fourth straight month to -$70.7B. While the Deficit continues to drop from all-time highs, it is very large relative to Deficits prior to 2022. Despite the large 33% fall from the -$107B in March, the current Deficit would have been an all-time record as recently as last June. It is also larger than July 2021.
Still, as shown in Figure 2, the last time the trade Deficit collapsed so quickly was in late 2008 during the peak of the Great Recession turmoil. It’s likely the current fall in Imported Goods is due to a rapidly deteriorating economy that is unable to import goods from abroad.
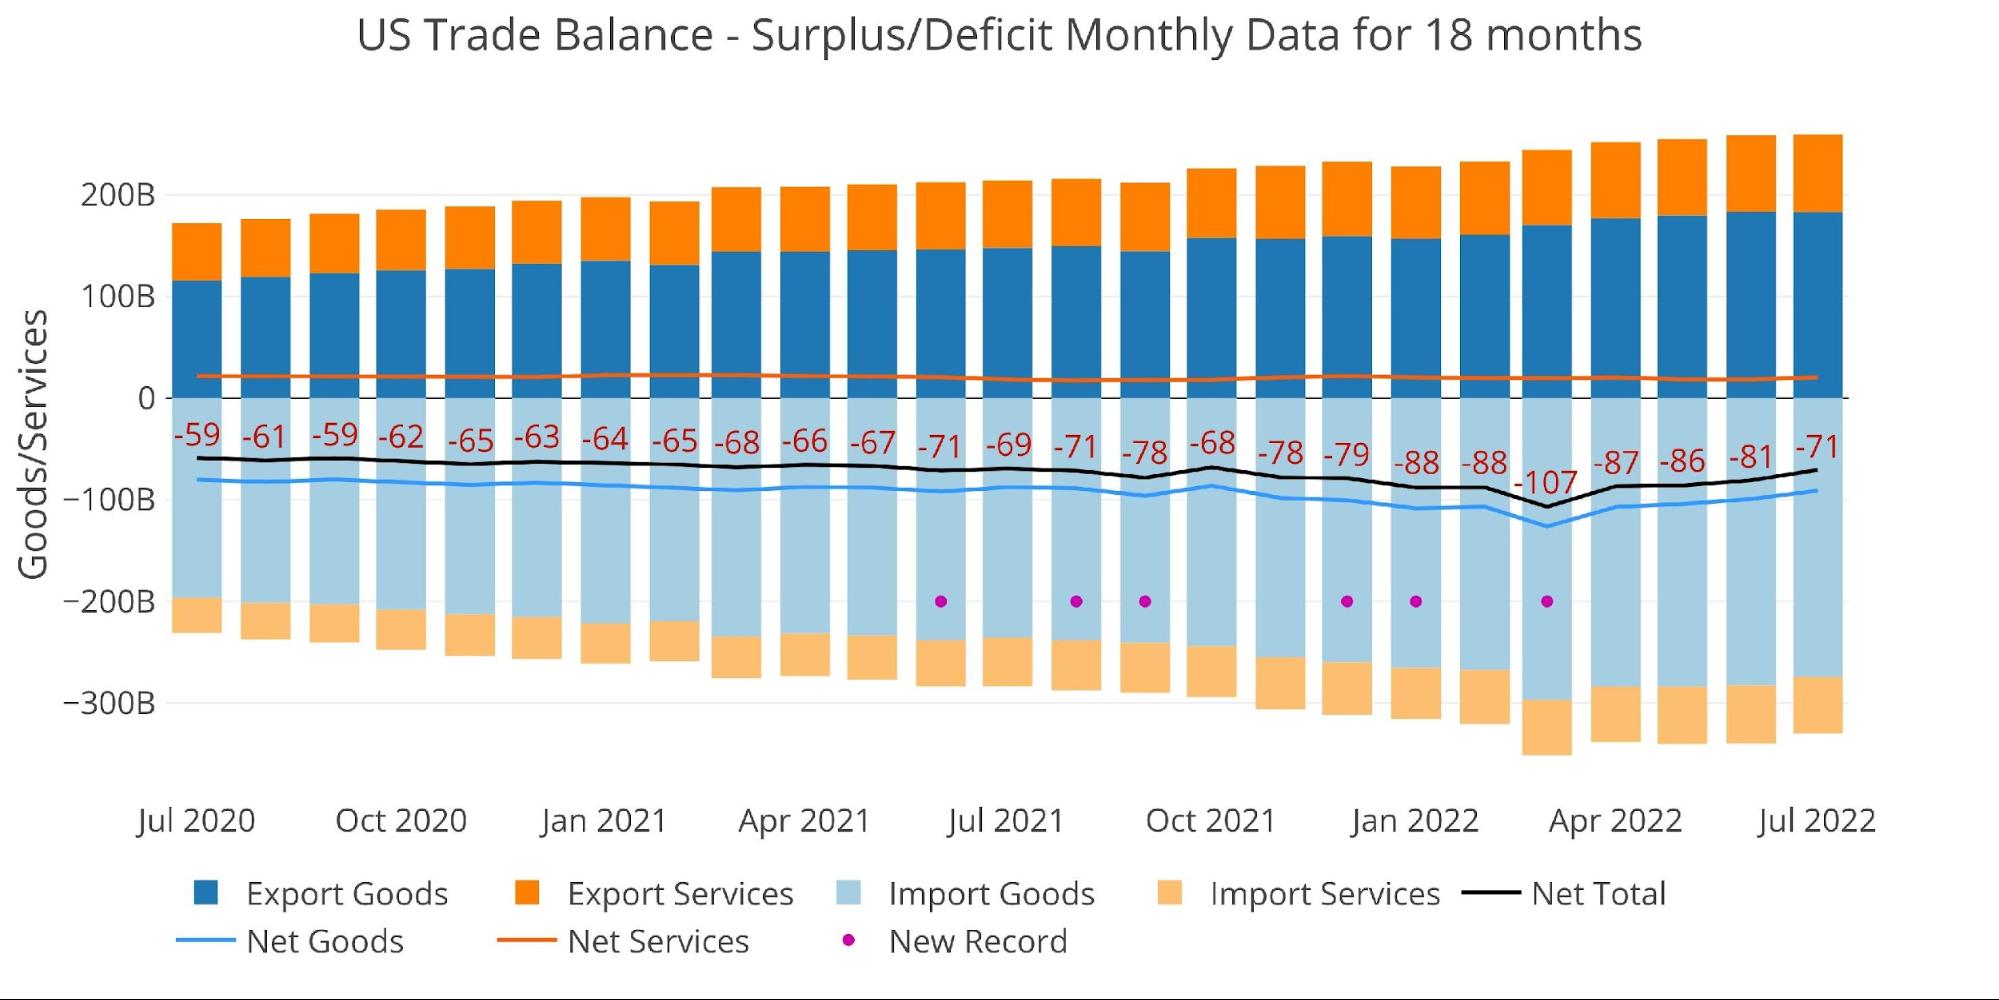
Figure: 1 Monthly Plot Detail
The table below provides detail.
Monthly Trade Deficit
-
- YoY Exported Goods is up $35B but Imported Goods is up $38.5B
- MoM saw no change in Exported Goods but a slight 3% drop in Imported Goods
- YoY Exported Services is up $10B while Imported Services is up $8B
- MoM Exported Services increased 1.1% while Imported Services fell 2.2%
Looking at Trailing Twelve Month:
-
- The Total Net Deficit reached a new record of $982B
-
- YoY, the Net Deficit is up 25.8%
- Compared to July 2020, the TTM Deficit is up 75%
-
- The TTM Services Surplus continues to shrink and is down 8.7% YoY and 18% since July 2020
- The Total Net Deficit reached a new record of $982B
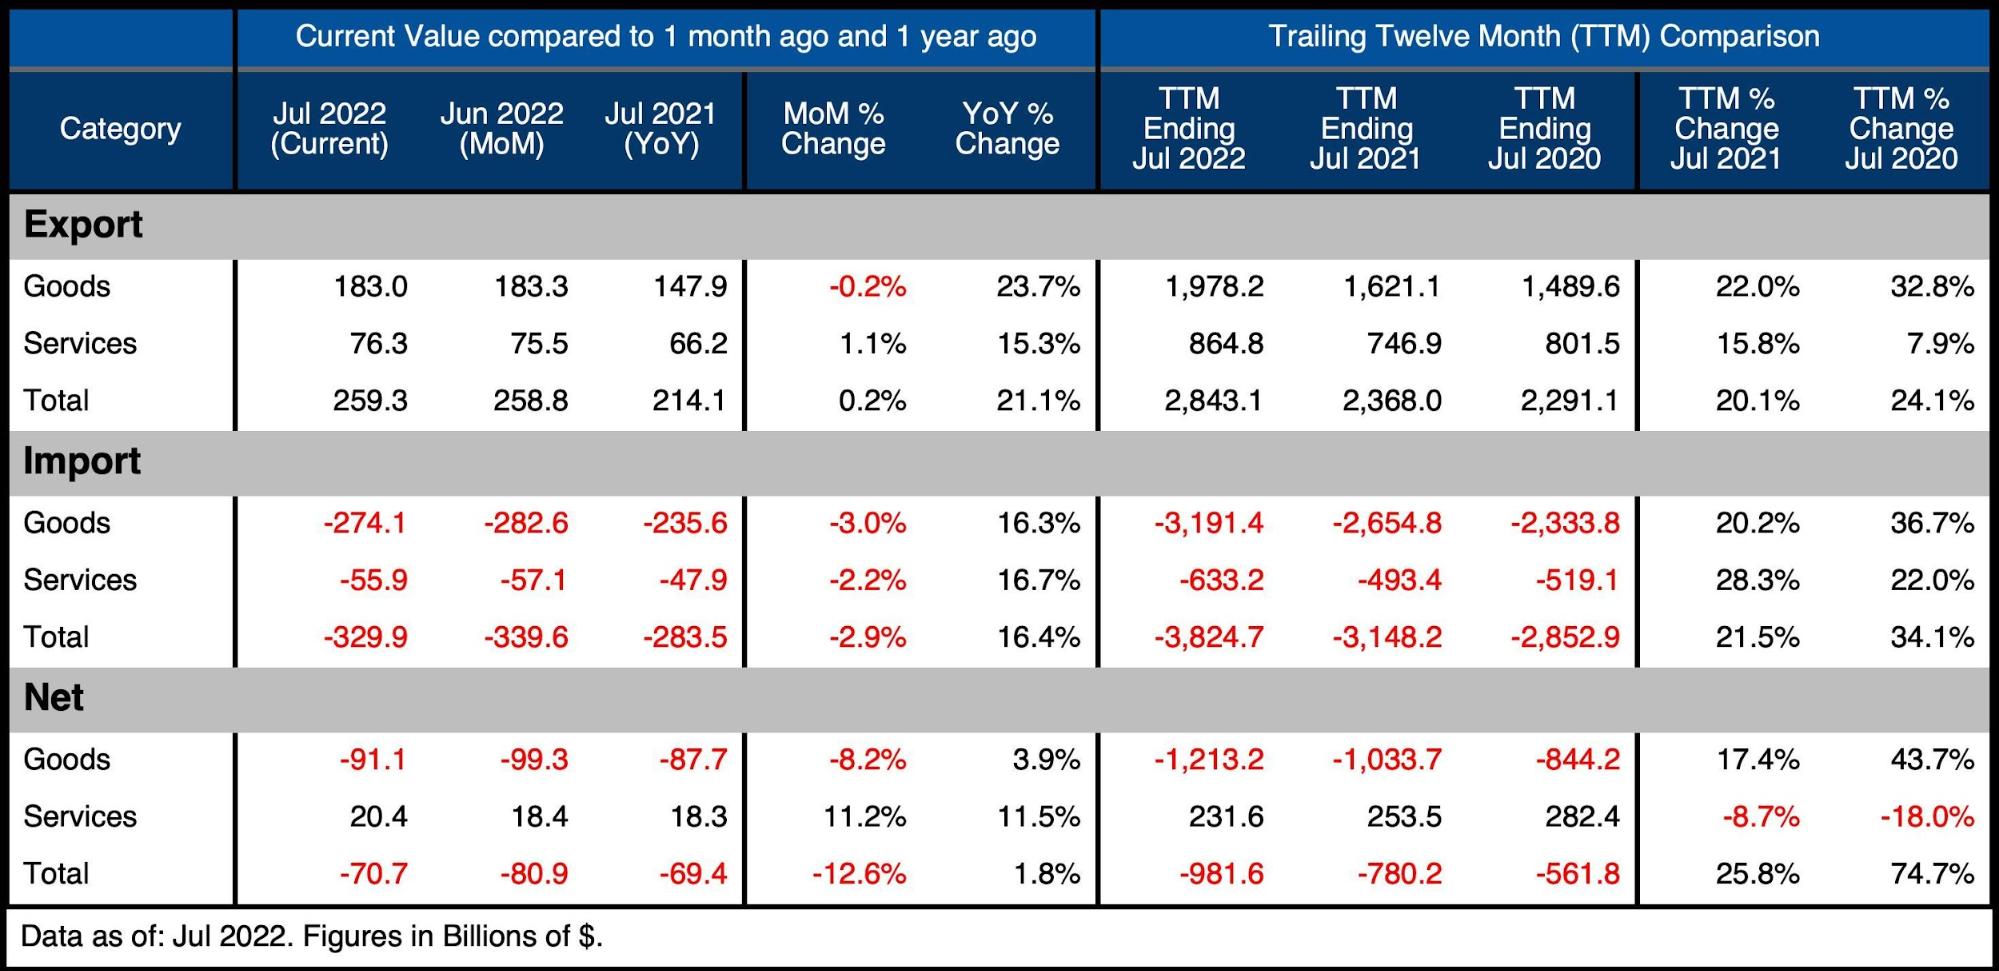
Figure: 2 Trade Balance Detail
Historical Perspective
Zooming out and focusing on the net numbers shows the longer-term trend. The massive Deficit spike in March has fully reversed. The last time the Trade Deficit has collapsed so quickly was in 2008. It’s likely there are outside forces creating the wild swings in the Deficit. The chart shows how extreme the data was leading up to March of this year.
The next few months should help show the nature of the current trend. Will Trade Deficits stabilize in the -$70B-$80B range? Will the collapse in Goods Deficit continue? It’s hard to think the Trade Deficit will be setting new records with the economy in such a tough spot. Inflation is eating up purchasing power and higher interest rates are putting extreme strain on the market.
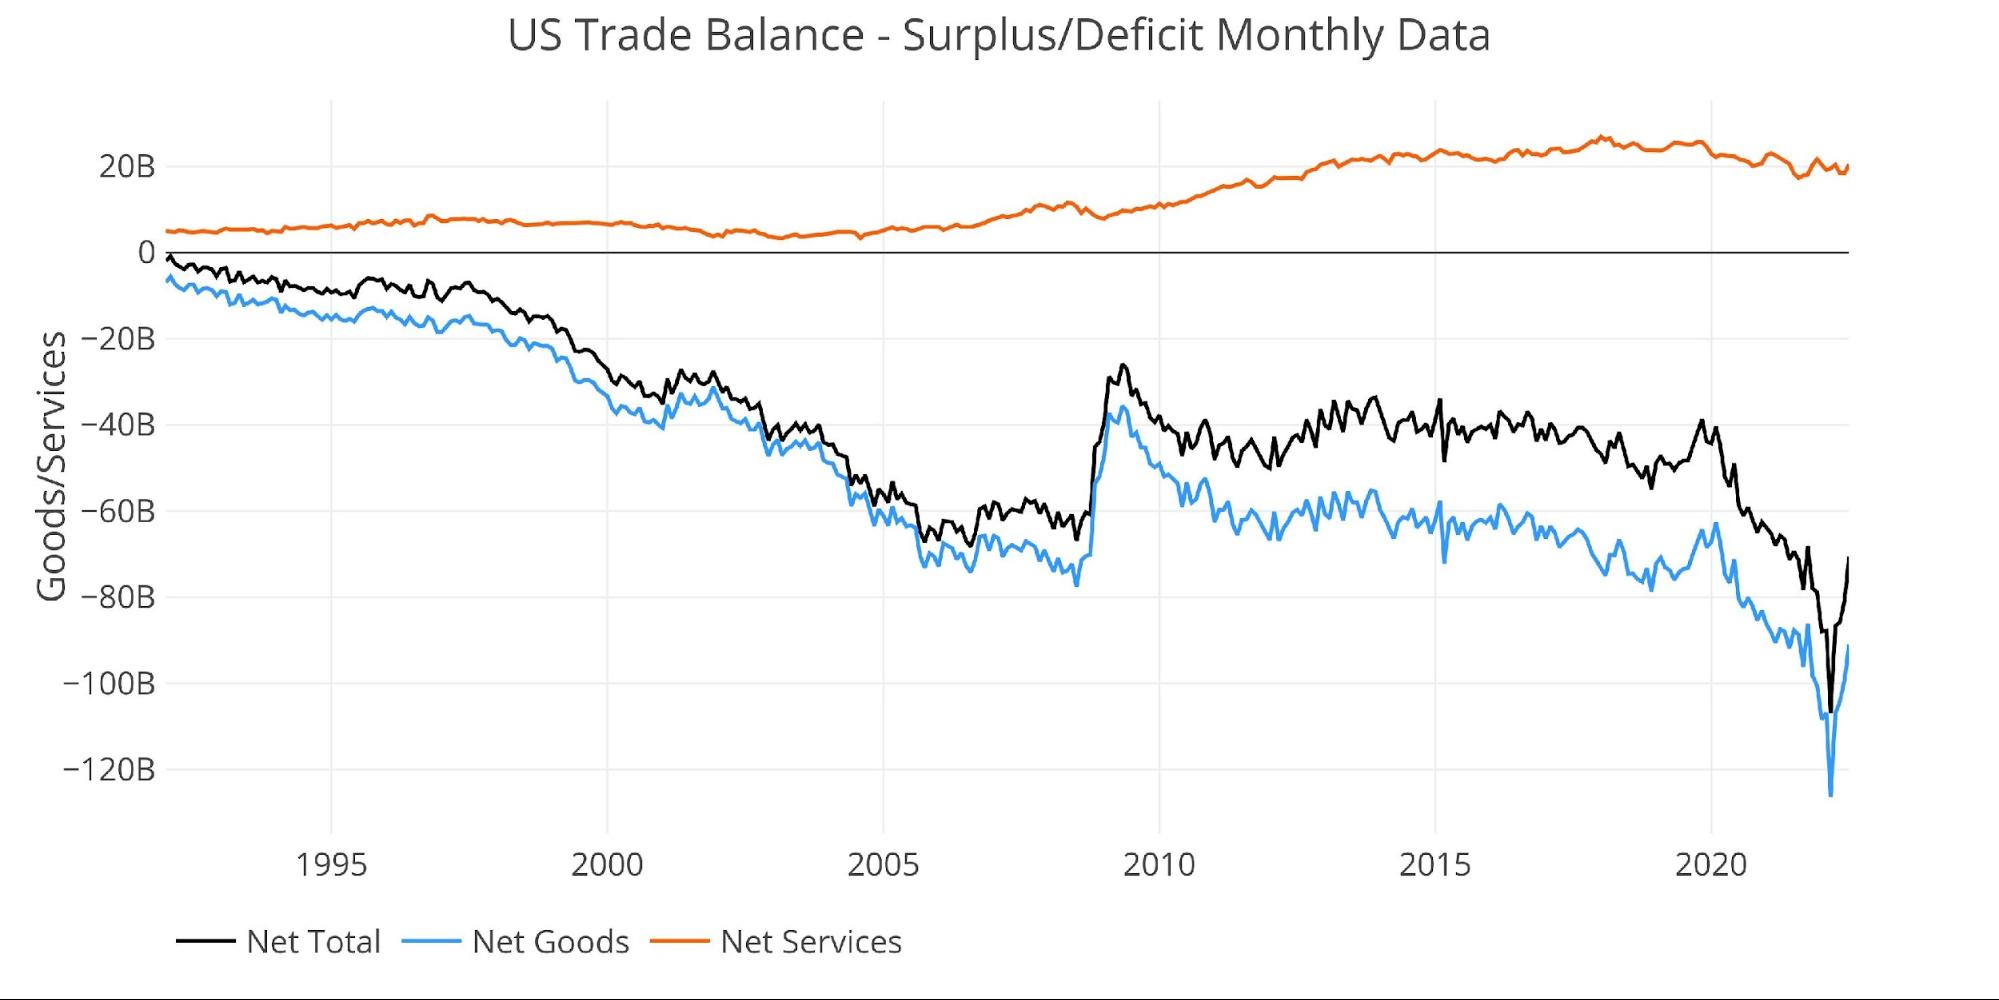
Figure: 3 Historical Net Trade Balance
The chart below zooms in on the Services Surplus to show the wild ride it has been on in recent months. It compares Net Services to Total Exported Services to show relative size. After hovering near 35% since 2013, it dropped below 30% in July last year. It has rebounded some, but is still historically low. If the Services Surplus continues to fall it will mean larger Trade Deficits in the future.
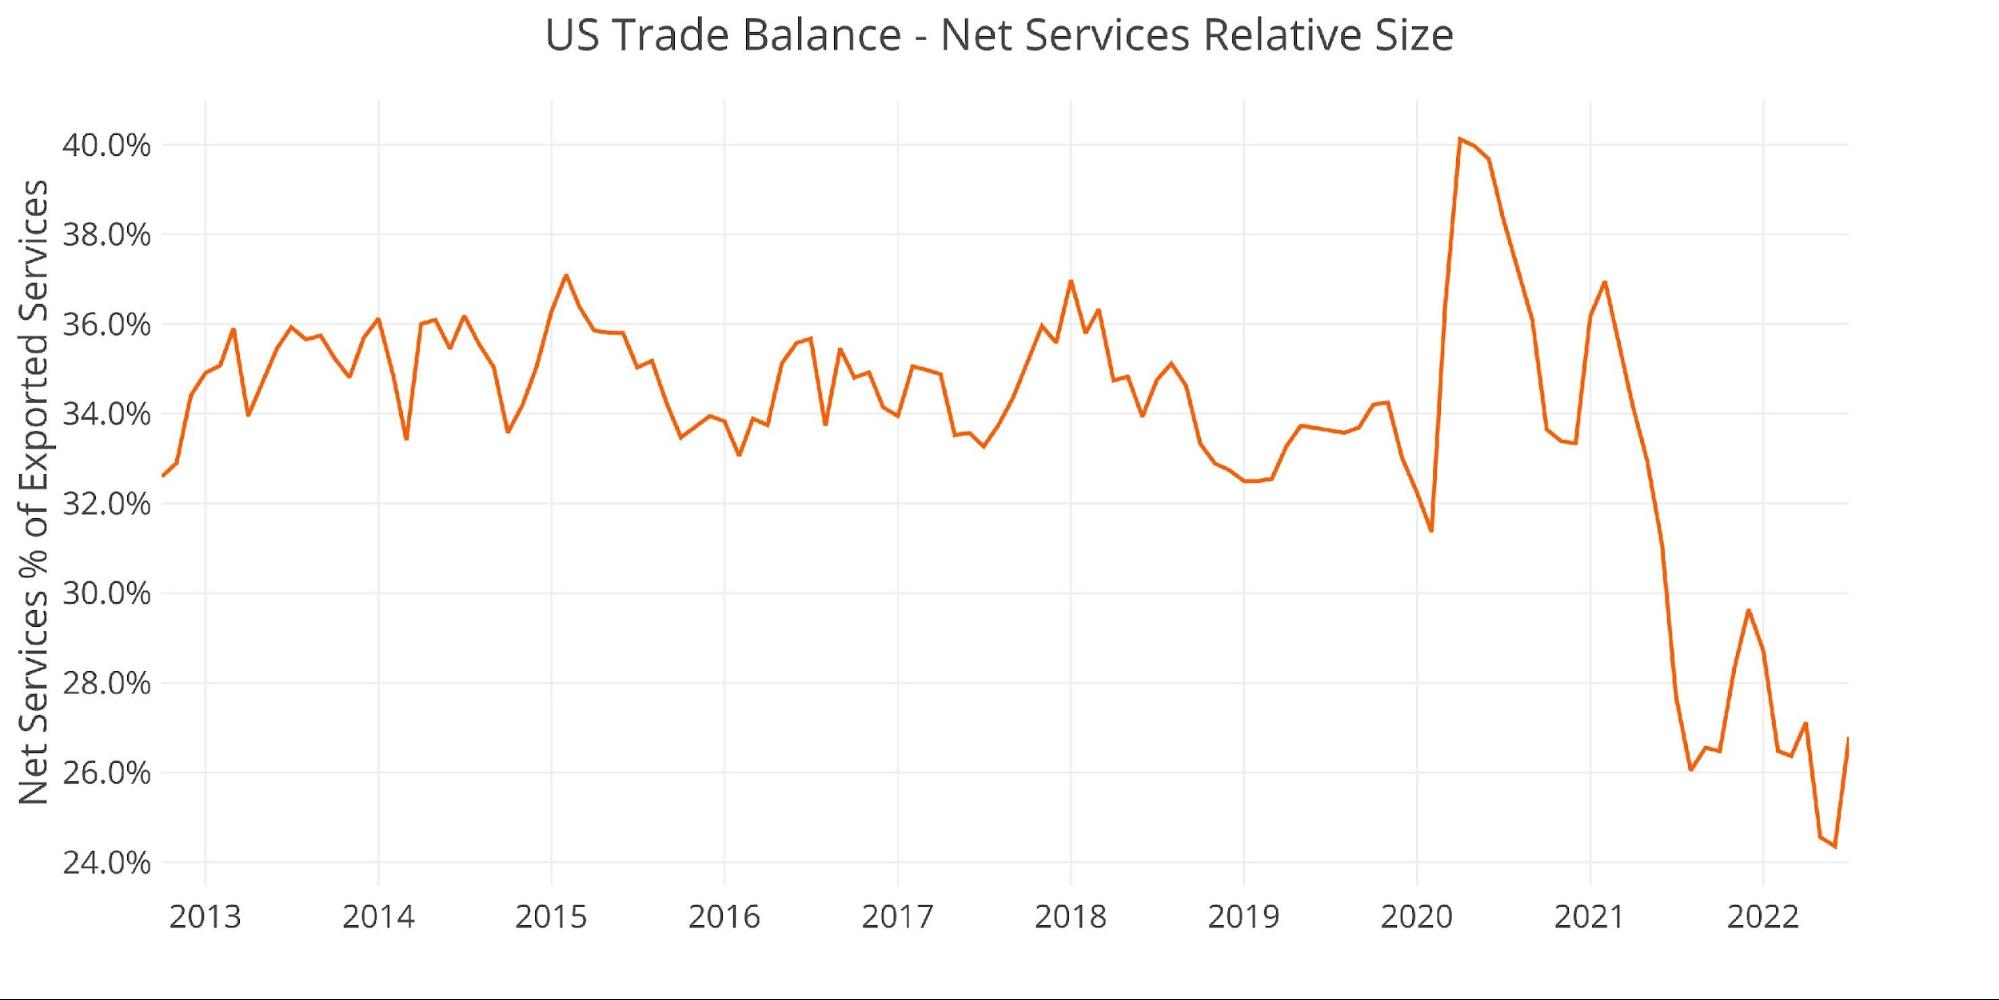
Figure: 4 Historical Services Surplus
To put it all together and remove some of the noise, the next plot below shows the Trailing Twelve Month (TTM) values for each month (i.e., each period represents the summation of the previous 12-months).
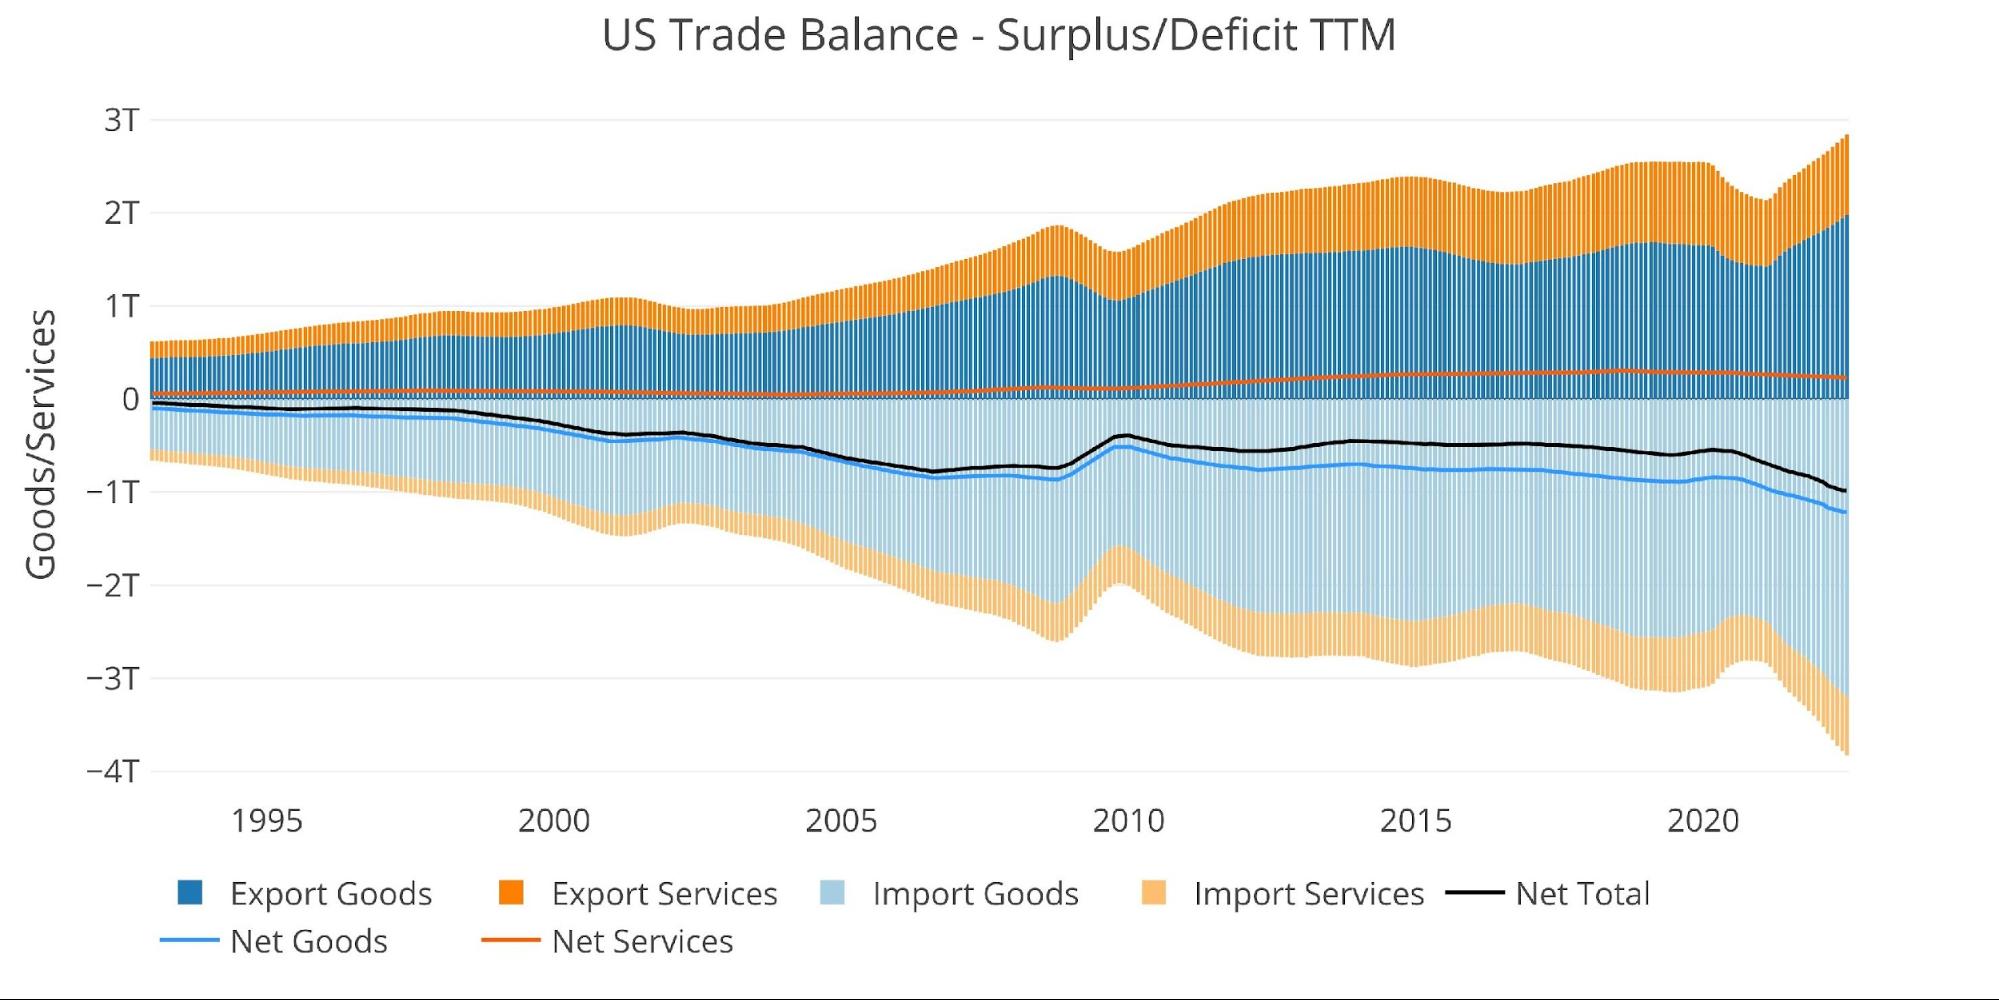
Figure: 5 Trailing 12 Months (TTM)
Although the TTM Net Trade Deficits is near historical highs, it can be put in perspective by comparing the value to US GDP. As the chart below shows, the current records are still below the 2006 highs before the Great Financial Crisis.
That being said, the current 3.94% is the highest since April of 2009 and up from 2.53% in March 2020.
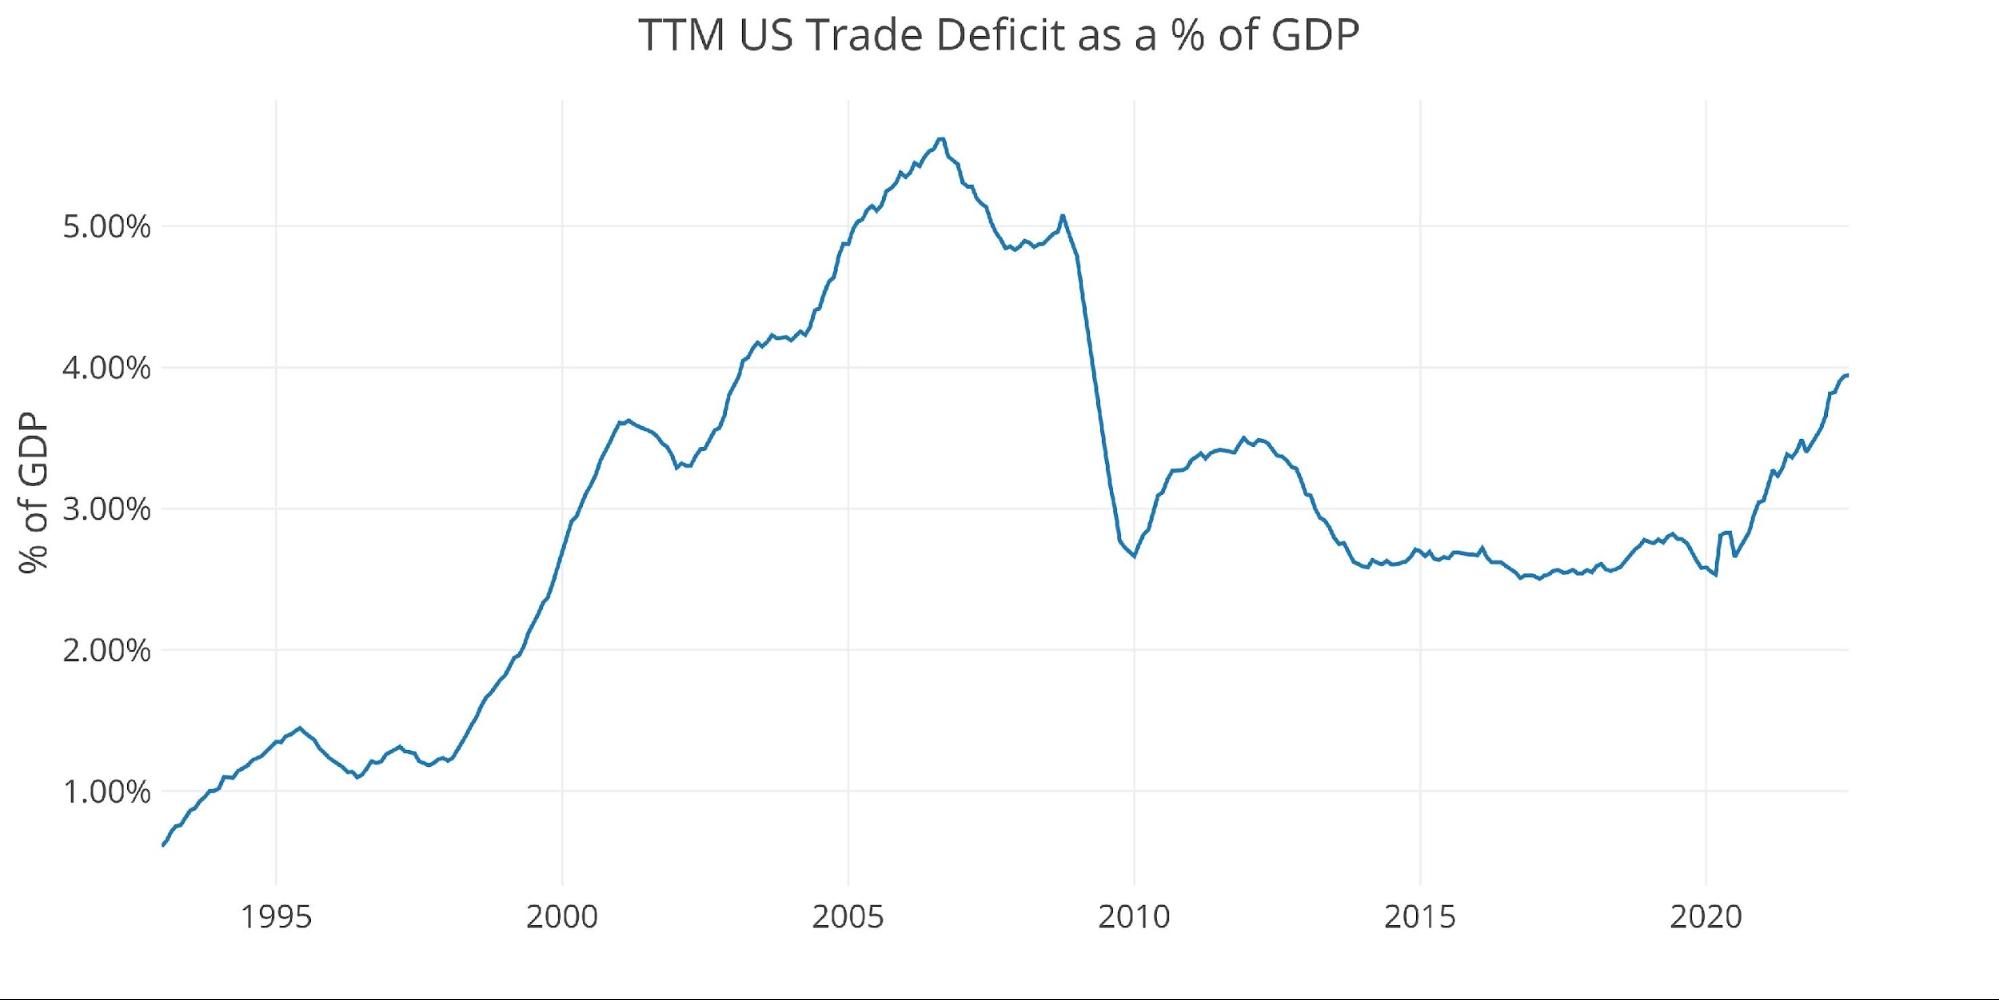
Figure: 6 TTM vs GDP
The chart below shows the YTD values. 2022 is well above prior years by a significant margin. Even though exports have surged this year, it has been offset by even bigger increases in imports.
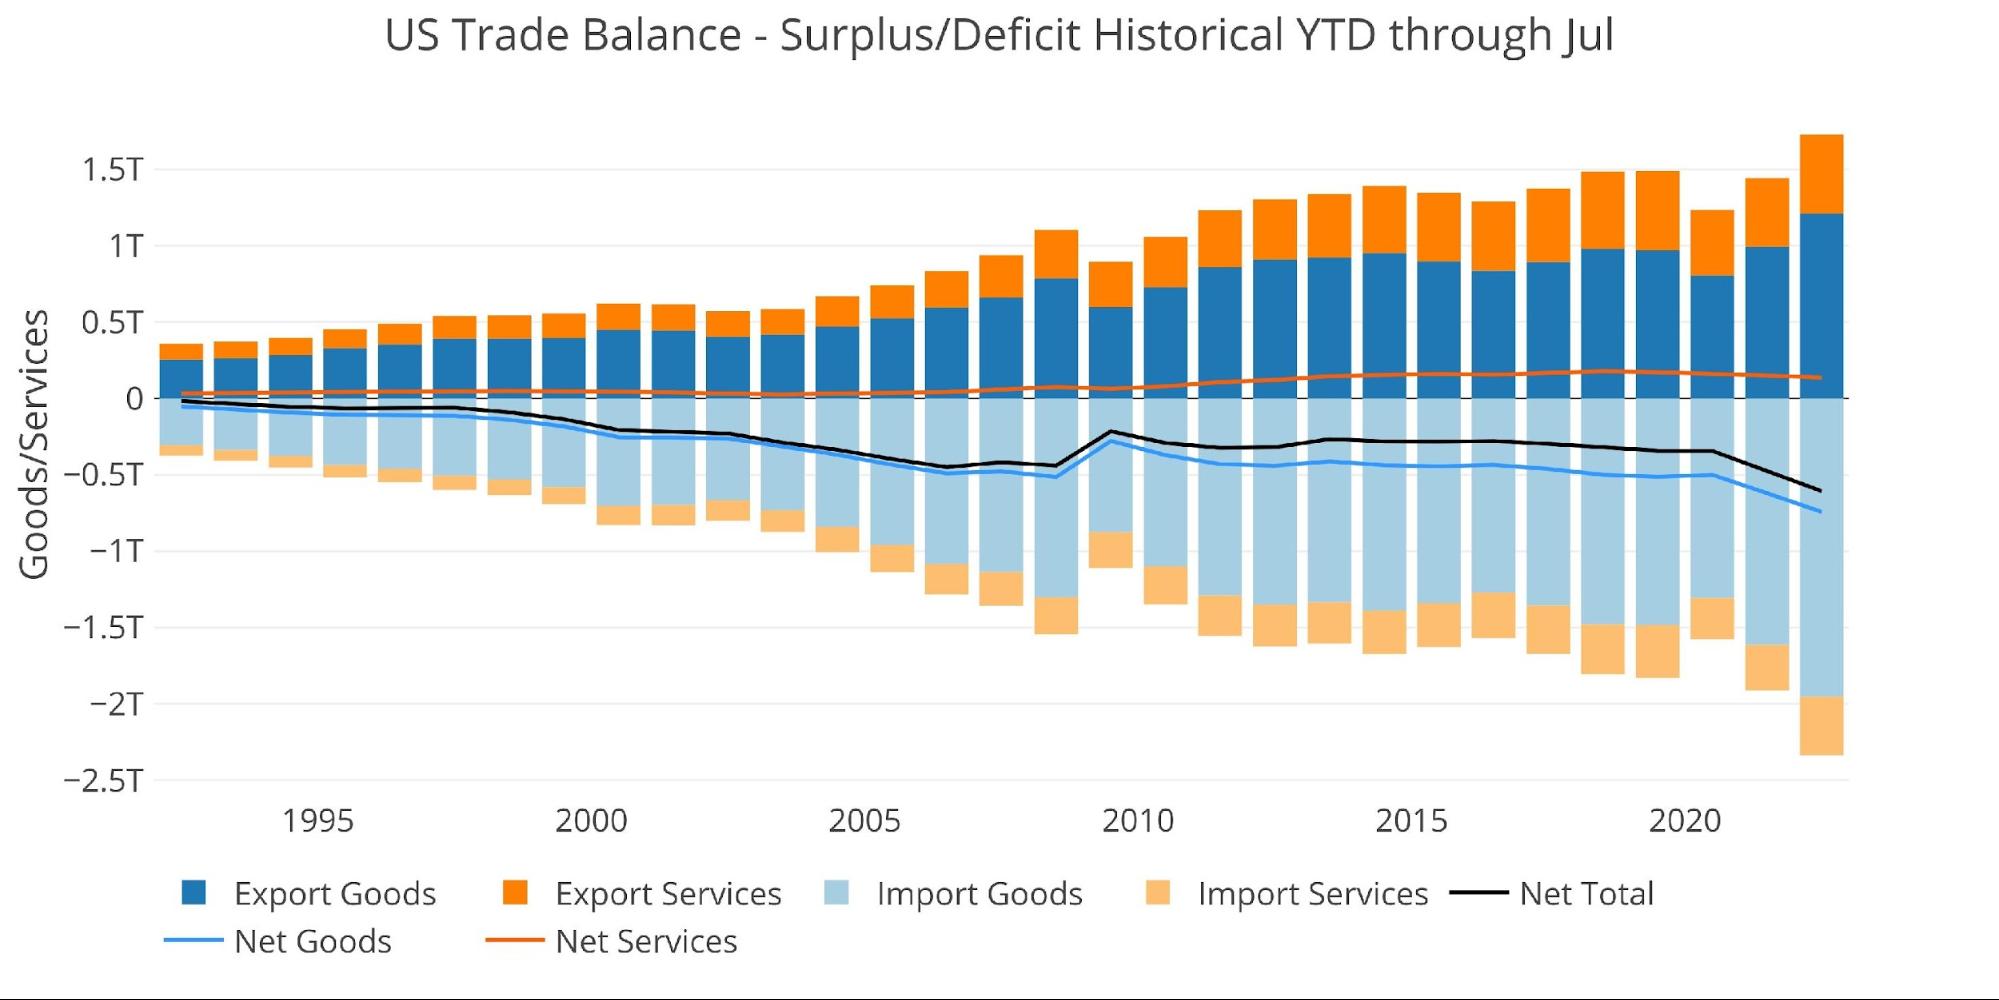
Figure: 7 Year to Date
What it means for Gold and Silver
The current trend in the Deficit can be interpreted multiple ways. On the one hand, it’s good the Deficit has been falling in recent months. However, it’s still historically high and the fall could be another sign of the weakening economy.
A strong economy would have trade surpluses as it produces more than it consumes. This would give rise to a strengthening currency increasing the purchasing power of the country. While the USD has been on a massive surge in recent months, this has been a flight to safety as the world reserve currency rather than anything related to a strong economy.
The mixed signals being sent makes it hard to draw any concrete conclusions, but it’s still clear that the US economy is importing way more than it exports. This means more dollars are being sent abroad. If the dollar were to ever start losing reserve currency status, this will create a flood of dollars combing back to the US. Investing in gold and silver is a great hedge and also a move into the true reserve currency of the world. Despite the recent price weakness, the data suggests that someone has a veracious appetite for both metals. Whoever is taking delivery of the metal likely sees what lies ahead.
Data Source: https://fred.stlouisfed.org/series/BOPGSTB
Data Updated: Monthly on one month lag
Last Updated: Sep 07, 2022 for Jul 2022
US Debt interactive charts and graphs can always be found on the Exploring Finance dashboard: https://exploringfinance.shinyapps.io/USDebt/

Call 1-888-GOLD-160 and speak with a Precious Metals Specialist today!
Buka akaun dagangan patuh syariah anda di Weltrade.
Source link