
Gold: Recent Delivery Month
Delivery volume for April gold is looking strong, beating out February. There are still 1,984 contracts open, so the month could even eclipse the total from last August.
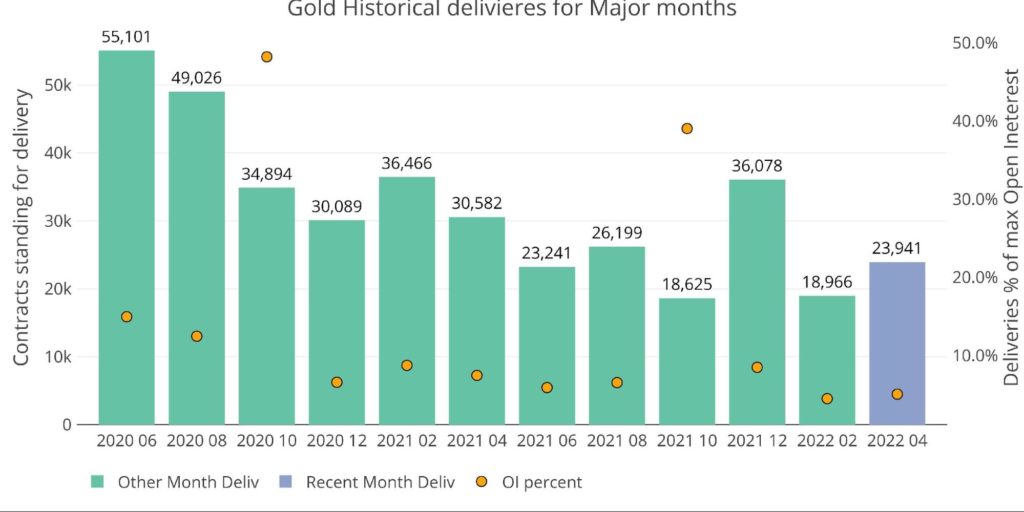
Figure: 1 Recent like-month delivery volume
The number of net new contracts is not insignificant at 779. It’s also not negative like February, but it’s still below the other major months over the last two years.
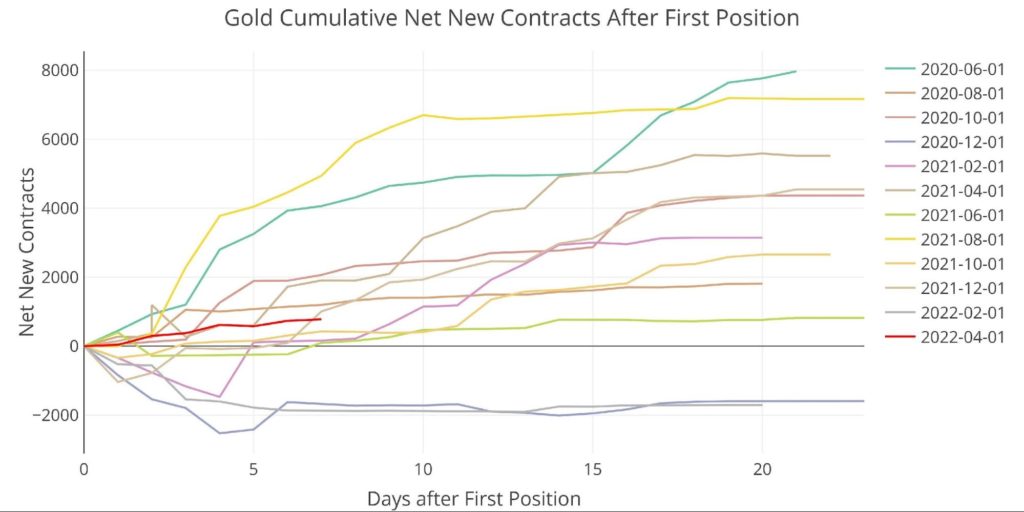
Figure: 2 Cumulative Net New Contracts
The surprising part is the action across the other house accounts. As shown below, for the first time since June of last year, the net action in the house accounts (excluding BofA) is positive. This is being driven primarily by Citi (4,012), followed by BofA (2,383), and HSBC (1,516).
Why have the house accounts all of a sudden flipped from net outflows to net inflows?
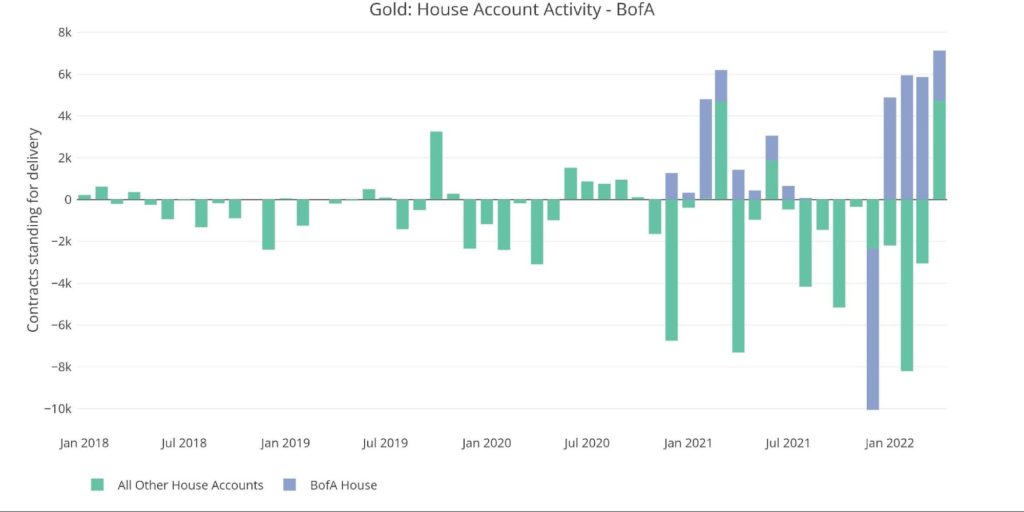
Figure: 3 House Account Activity
A look at the stock report shows that the bullion banks are still restocking gold at a very fast pace. As deliveries continue to increase, the vaults will need to restock to meet demand. March had the biggest restock since July 2020.
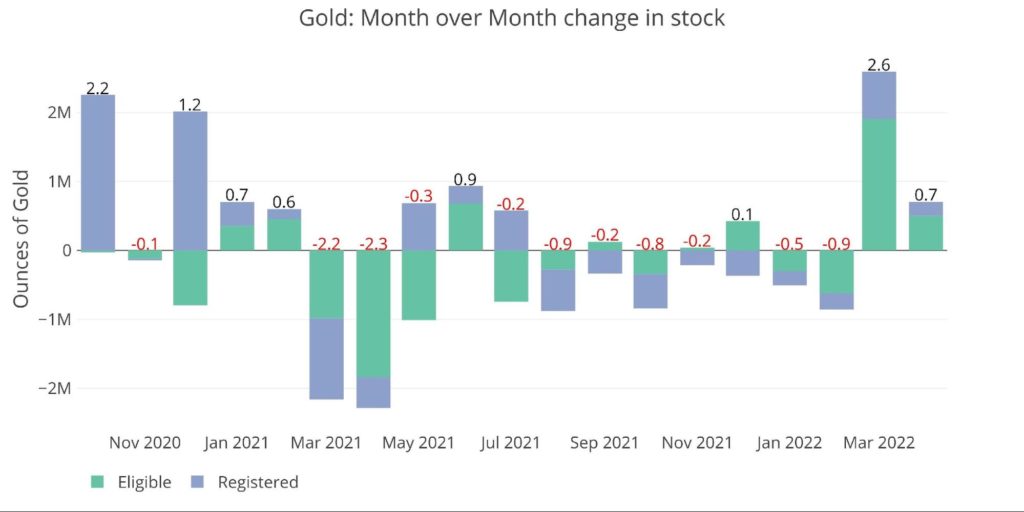
Figure: 4 Recent Monthly Stock Change
Gold: Future Delivery Months
May has taken an interesting turn downward instead of continuing to move up. This is not totally unprecedented as can be seen below, but it’s still surprising given all the other indicators.
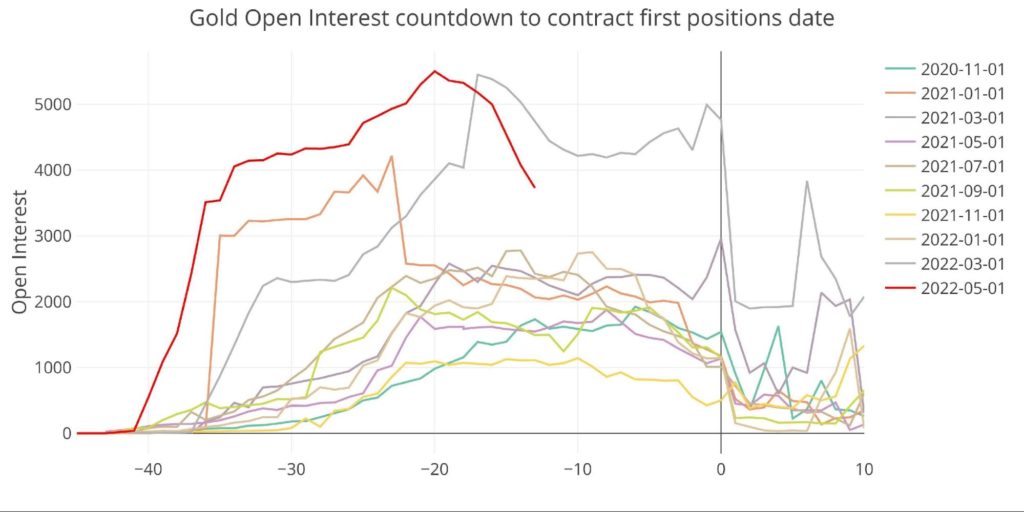
Figure: 5 Open Interest Countdown
For example, June continues to move up and sits higher than all other months except for April 2020 (which was peak Covid uncertainty).
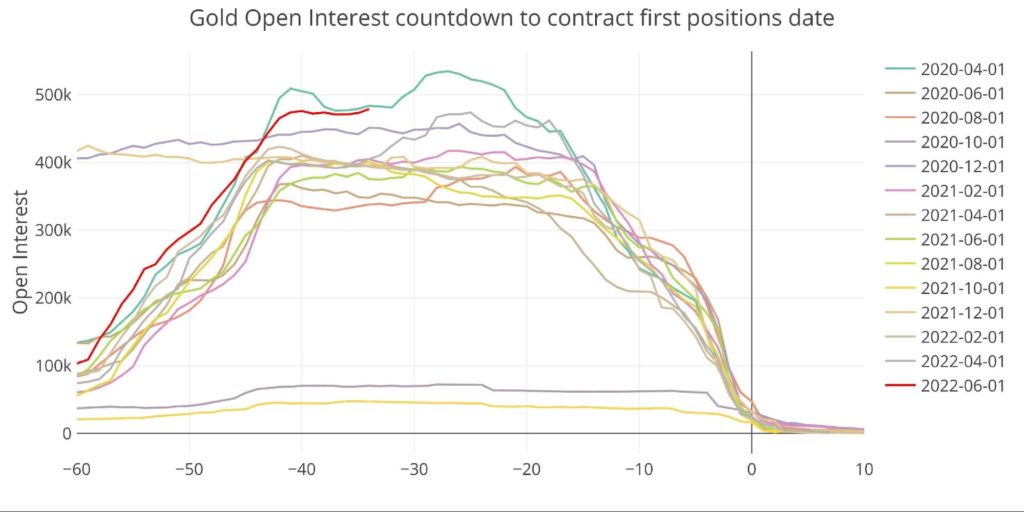
Figure: 6 Open Interest Countdown
Another major data point is the spreads. The chart below shows the spread between the June and August contract. The market Contango is growing, meaning later months are getting more expensive than closer months. This happens when the market anticipates higher prices in the months ahead.
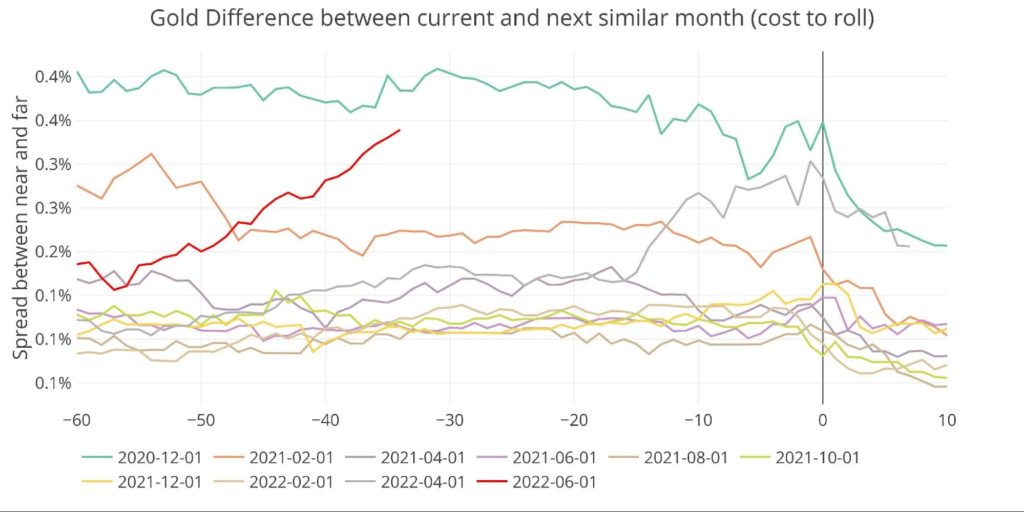
Figure: 7 Spreads
A quick check on margin rates shows the CME is still hesitant to raise margin requirements. An increase will almost certainly slow any price advance.
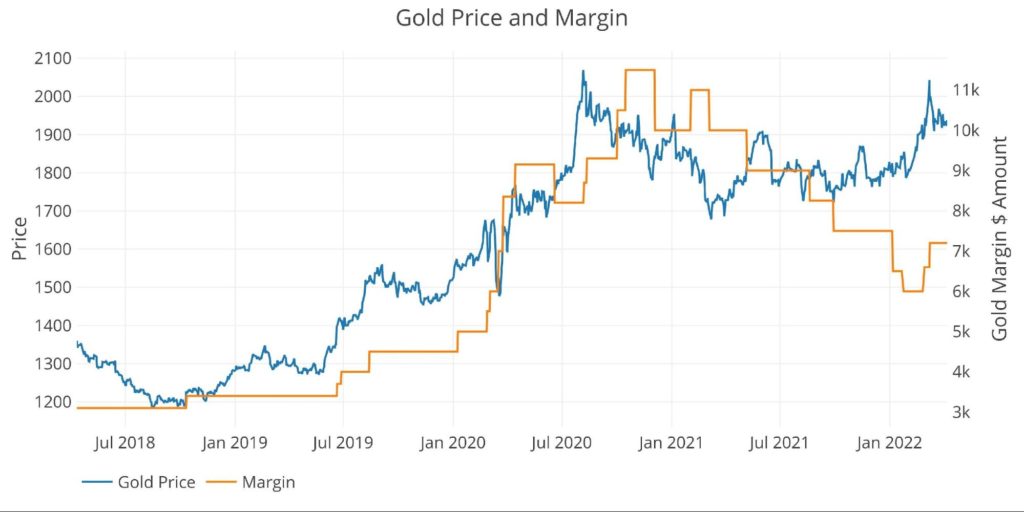
Figure: 8 Gold Margin Dollar Rate
Another US Debt Chart
This is not completely related to the Comex, but I was reviewing the US Debt data this weekend after completing the analysis on the debt last week. I put together a very interesting chart. Below shows the average interest on the debt held by the public (~$23T Marketable securities) and also the average maturity.
As shown, the Treasury has been able to extend the average maturity of all the debt it holds. This was a critical initiative last year as seen in the chart. Perhaps this was in anticipation of rising rates. However, will the extension be enough to delay the impact of rising rates? Given that almost all maturities on the yield curve (from 2yr to 30yr) are at 2.6 or above, the current average weighted rate of interest (1.3%) is half the current rate of the yield curve. If bonds keep falling as they have been, this could get very dangerous for the Treasury.
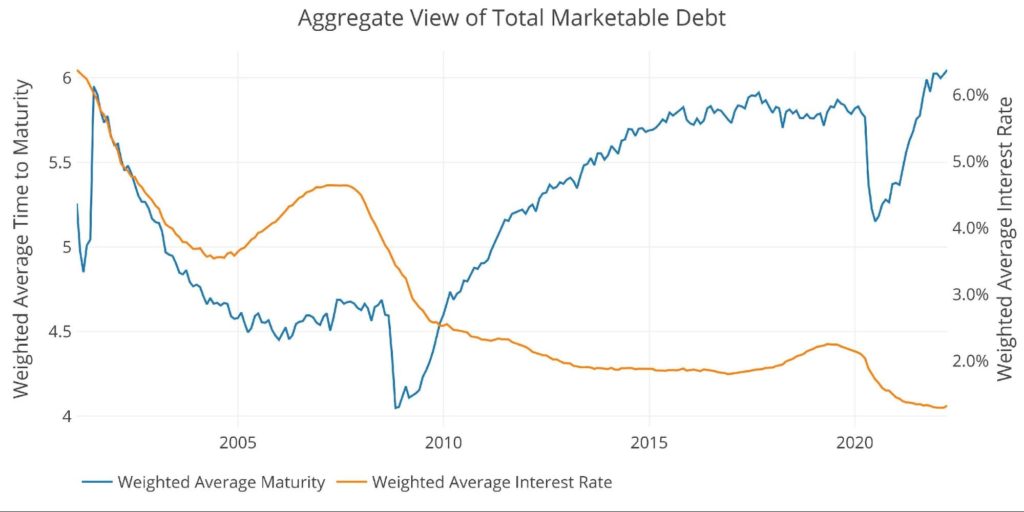
Figure: 9 Weighted Averages
Data Source: https://www.cmegroup.com/
Data Updated: Nightly around 11 PM Eastern
Last Updated: Apr 08, 2022
Gold and Silver interactive charts and graphs can be found on the Exploring Finance dashboard: https://exploringfinance.shinyapps.io/goldsilver/

Call 1-888-GOLD-160 and speak with a Precious Metals Specialist today!
Buka akaun dagangan patuh syariah anda di Weltrade.
Source link