The BTC/USD pair will likely do a break and retest pattern by moving back to the resistance at 45,850.
Bullish view
- Buy the BTC/USD and set a take-profit at 45,800.
- Add a stop-loss at 40,000.
- Timeline: 1-2 days.
Bearish view
- Set a sell-stop at 42,000 and a take-profit at 40,000.
- Add a stop-loss at 44,000.
The BTC/USD pair held steady in the overnight session even after hawkish statements by the Federal Reserve chair. The pair rose to 43,000, which was higher than this week’s low of about 39,673.

Bitcoin in a Relief Rally
The BTC/USD pair has been in a strong bearish trend in the past few months as worries about the Federal Reserve have risen. The pair has declined by over 40% from its all-time high that happened in November.
The weak performance is mostly because of the ongoing rotation from high-risk assets like cryptocurrencies to value assets. This explains why there have been a close correlation of Bitcoin and Nasdaq, an index made up of the biggest technology companies in the US.
On Tuesday, Jerome Powell, the Fed Chair, said that he will embrace a more hawkish tone this year if he gets a second term. This means that he will end the quantitative easing policy that has pushed quantitative easing to an all-time high of over $9 trillion. The bank will also start a rate hike cycle in its battle against inflation.
Historically, high-risk assets tend to underperform in a period of rate hikes. For example, after soaring to an all-time high in 2017, Bitcoin suffered its biggest decline in 2018 when the Fed made four rate hikes.
The BTC/USD pair will react to the latest American consumer price index data that will come out later today. Analysts expect the data to show that the headline CPI rose to 7% in December while core CPI rose to over 5%.
The BTC/USD also rose after the Fed chair said that the bank was done with its comprehensive study on Bitcoin and other cryptocurrencies. This report will likely form a basis of regulations.
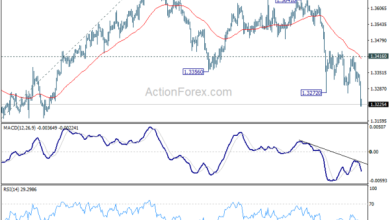
BTC/USD Forecast
The four-hour chart shows that the BTC/USD pair has been in a strong bearish trend in the past few weeks. The pair’s weakness accelerated on January 5th when it moved below the key support at about 45,850.
This was a notable price because it was also the neckline of the small head and shoulders pattern that was forming. Measuring the distance between the head and shoulder of this pattern shows that it was also equal to from the shoulder to the lowest level this week. Therefore, the pair will likely do a break and retest pattern by moving back to the resistance at 45,850.

Source link