Gold Price talking points:
- Last week started with strength for Gold as the yellow metal tipped-up to the 1850 spot of resistance on the chart. But that was quickly faded with another injection of weakness around the FOMC rate decision.
- Gold prices are bouncing from fresh monthly lows on the final trading day of the month, but a heavy economic calendar combined with the continuation of the higher rates theme keeps the focus on the short side of Gold prices.
- The analysis contained in article relies on price action and chart formations. To learn more about price action or chart patterns, check out our DailyFX Education section.
Gold prices set a fresh monthly low on Friday as the bearish reversal that started last Tuesday continued through the Fed and into the end-of-the-week. Support finally showed up at the 1784 spot that was looked at on Thursday. That was a swing-low from late-December that came into play earlier in January, only to be tested through last Friday before a bounce appeared.
At this point, that bounce does look corrective in nature and the 1800 level that was in-play as support last Thursday is now showing as short-term resistance. There’s still some bullish potential here, as we’ve only retraced about 23.6% of last week’s short-side move and, logically speaking, there’s still some shorts that would look to cover ahead of month-end.
The 38.2% Fibonacci retracement of last month’s sell-off is confluent with the prior support swing around 1805. And the 50% marker of that move lines up with another familiar level, taken from around 1815 which is nearing confluent with prior trendline support. Each of these spots could be significant points of interest for lower-high resistance in bearish continuation scenarios.
Gold Four-Hour Price Chart
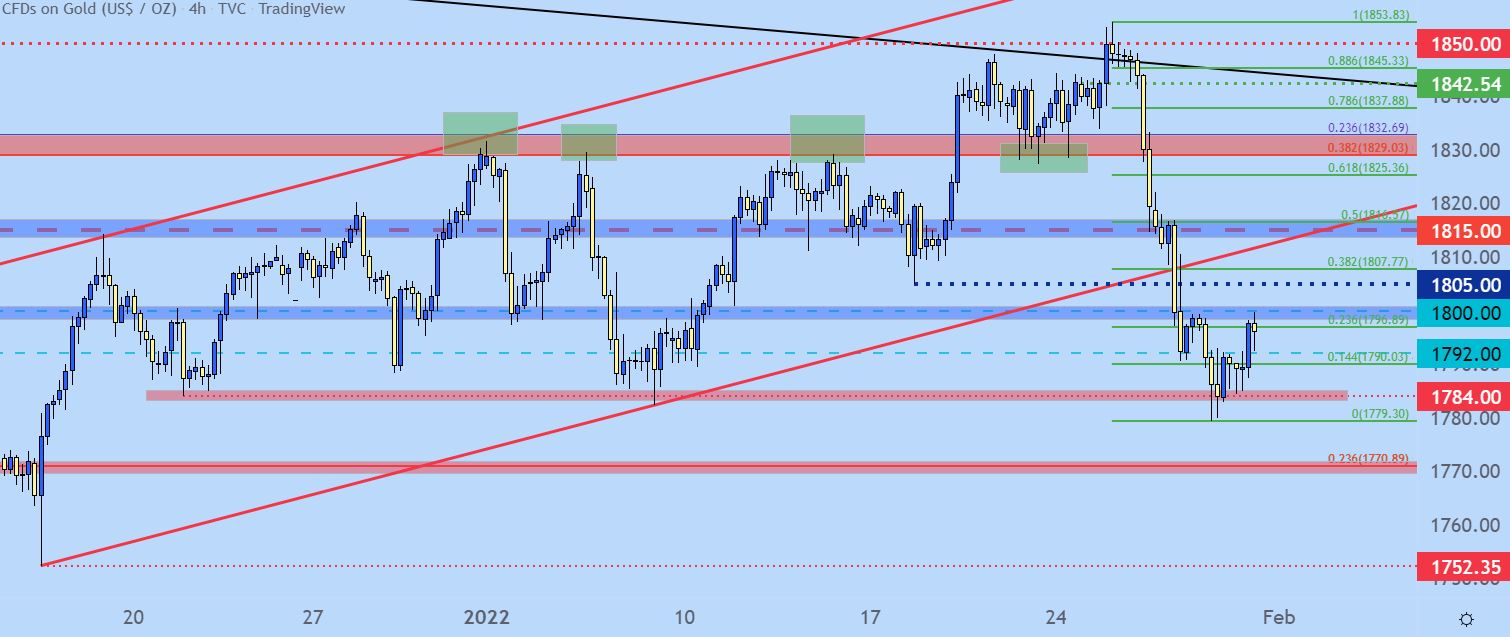
Chart prepared by James Stanley; Gold on Tradingview
Gold Short-Term: More Pullback Potential
Gold prices broke down aggressively last week and oversold readings quickly flashed on the four-hour chart. This led to a slow build of support around the 1784 level and this week has seen an early push up to the 1800 psychological level. But, there’s now been a higher-low and a higher-high, and this shows the prospect of a deeper recovery before that bearish trend might come back into order.
For this theme to remain alive, support holding above 1790-1792 is key, and that keeps the door open for a push back up to the 1815 zone, the top-end of which is marked by the 50% marker of the recent major move at 1816.57.
Gold Two-Hour Price Chart
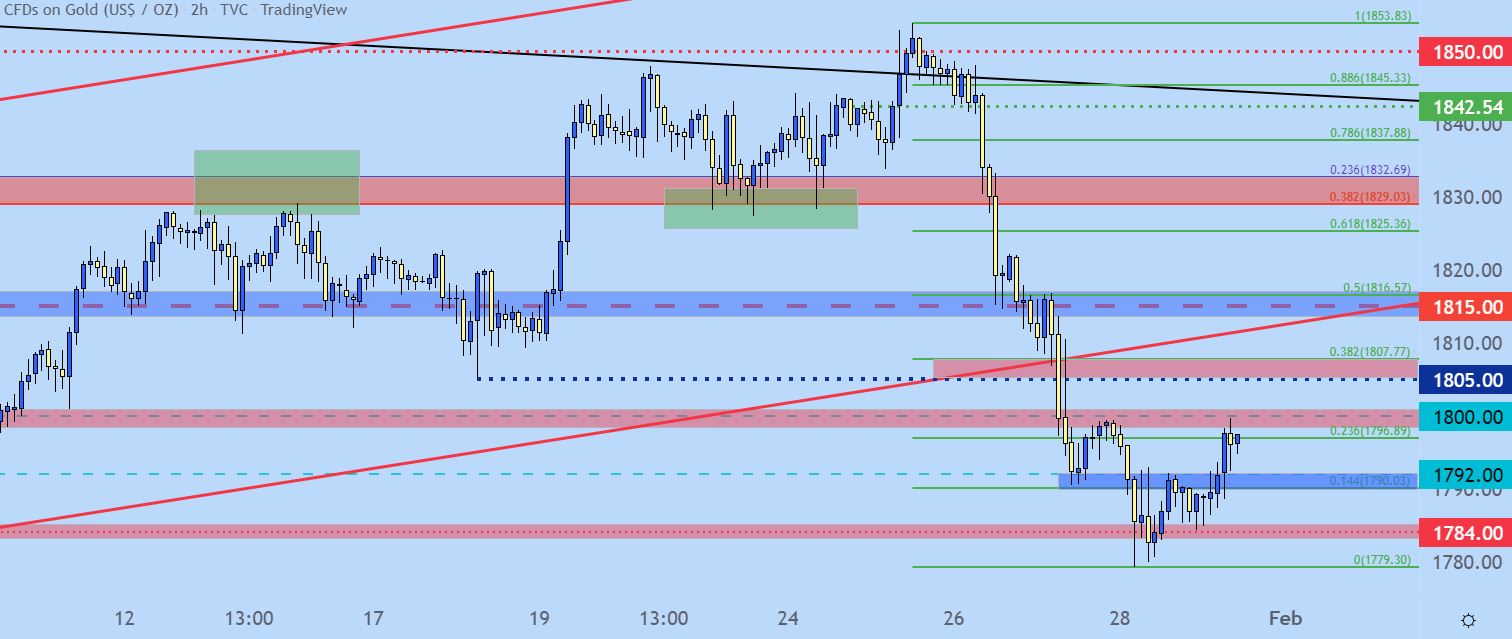
Chart prepared by James Stanley; Gold on Tradingview
Gold Longer-Term: Bearish Initiation of Longer-Term Theme
As we near month-end the longer-term charts are worth a look in Gold. The descending triangle formation continues to coil and this month saw the bearish trendline tested when that false breakout showed-up last week. That led to a strong move that erased the entirety of the gain that had built thus far in January. But, perhaps more notably, Gold has spent the bulk of the past two months in a choppy range between 1770 and 1830.
Given the intense focus on the Fed and the prospect of higher rates, it would seem that the bearish fundamental backdrop would mesh with this bearish technical potential, as shown by the descending triangle. But – this also puts into focus key supports below the current lows for traders to hone in on. The 1680-1700 level is what marks support for the triangle. This zone was tested thrice last year and has yet to give way. Above that, a Fibonacci level exists at 1734 and 1752 is the current home of the three-month-low.
Gold Weekly Price Chart
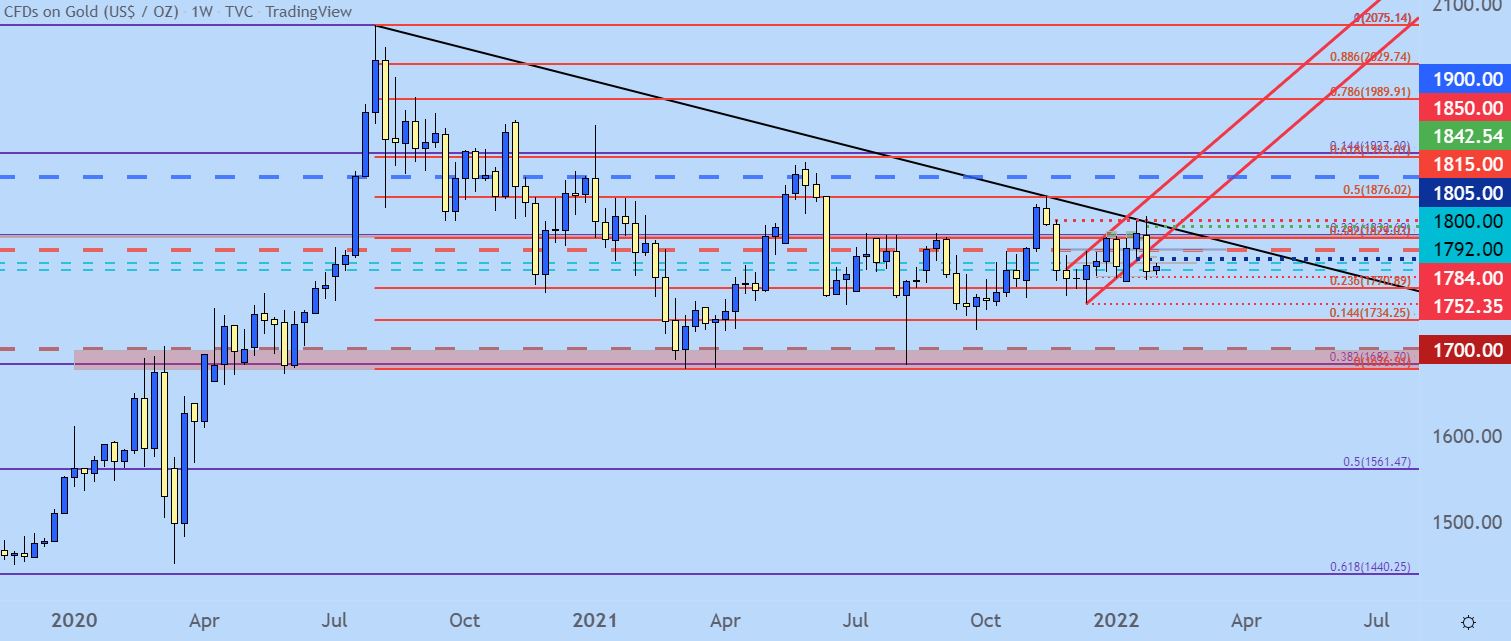
Chart prepared by James Stanley; Gold on Tradingview
— Written by James Stanley, Senior Strategist for DailyFX.com
Contact and follow James on Twitter: @JStanleyFX
Buka akaun dagangan patuh syariah anda di Weltrade.
Source link