
According to the BLS, the economy added 431k jobs in March. February was revised up to 750k from an original 678k. The unemployment rate fell to 3.6%.
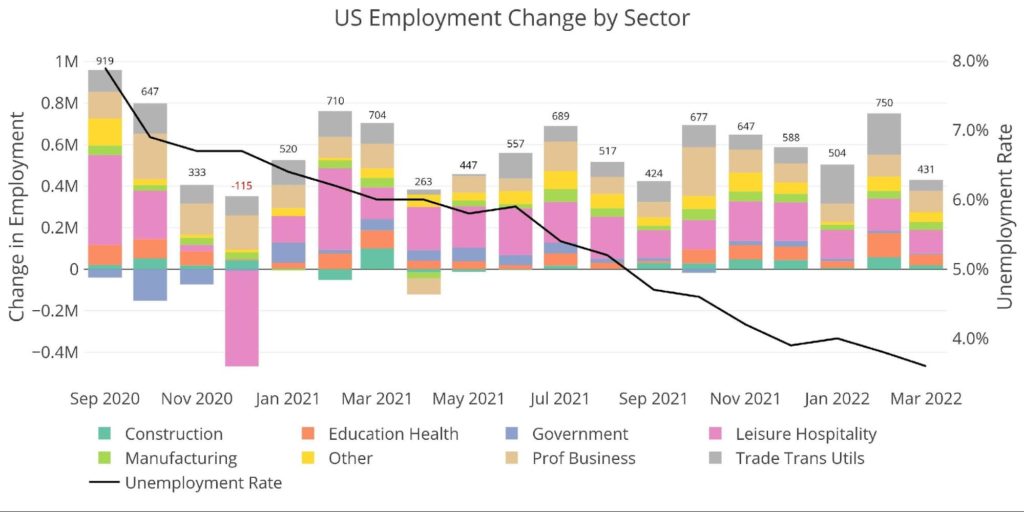
Figure: 1 Change by sector
At first glance, this looks like another strong jobs report; however, the detailed numbers reveal some important nuances. First, remember that the BLS takes raw data and makes massive adjustments to the numbers. The raw data is shown below indicating the economy actually added 800k jobs in March.
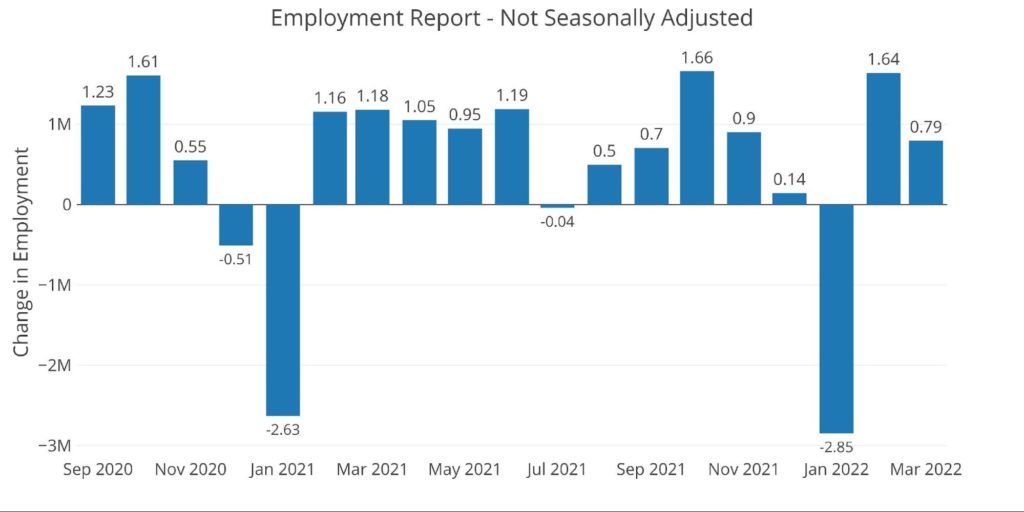
Figure: 2 Monthly Non-Seasonally Adjusted
Adjustments are made to smooth out the data throughout the year. The chart below compares the adjusted and unadjusted values for an entire year. By December, the total jobs always converge. The BLS models use historical data to spread out gains and losses as the year progresses.
As shown below, through three months in 2022, the BLS is adjusting the raw number up quite substantially (-414k vs +1.7M). This means the BLS is expecting the economy to make up the gap as the year progresses.
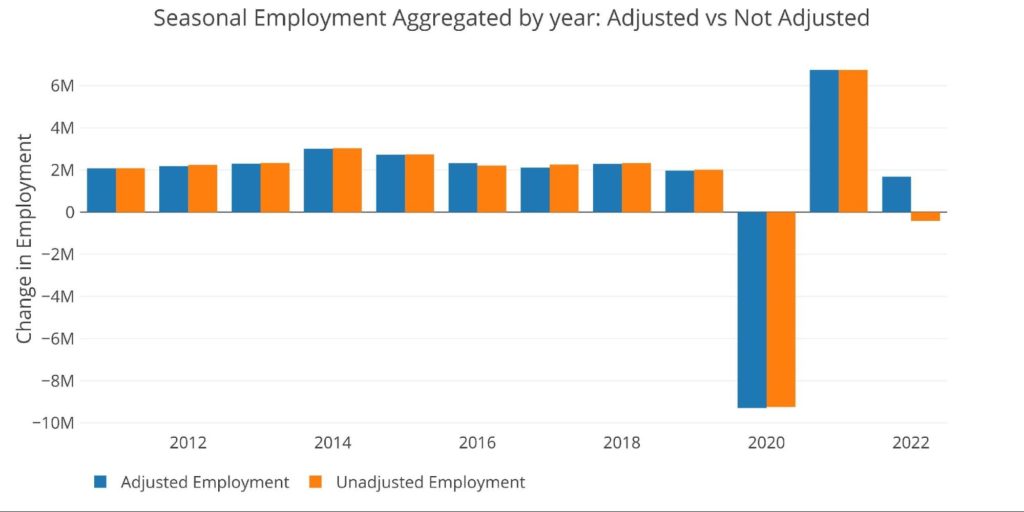
Figure: 3 Annual Adjustment Convergence
While the raw March number was strong, it was actually not that strong compared to history. Looking at the details:
- Mar 2022 – Actual: 794k; Adjusted: 431k; Adj Down: 45.7%
- Mar 2019 – Actual: 675k; Adjusted: 224k; Adj Down: 66.8%
- Mar 2016 – Actual: 895k; Adjusted: 237k; Adj Down: 73.5%
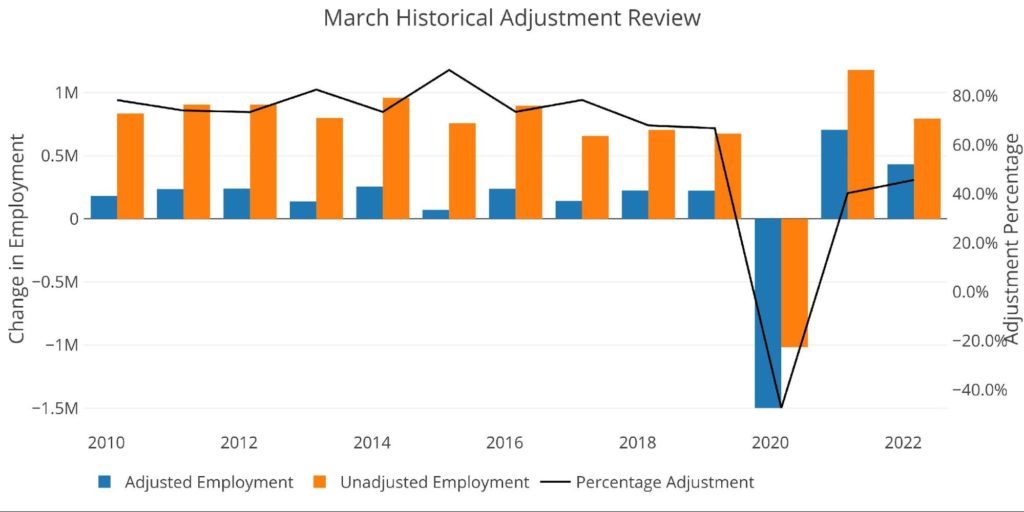
Figure: 4 YoY Adjusted vs Non-Adjusted
So, what does this mean? In short, March is typically a strong jobs month and historically, the BLS adjusts the number down. The effect of this can be seen in March 2020. The adjustment down actually brought the adjusted jobs deeper negative than the raw number.
However, the current adjustment down is significantly smaller than it was historically (black line). This means that the BLS is anticipating much stronger jobs growth this year than what typically happens.
Could strong jobs materialize? Maybe… but maybe not. The Fed is starting to tighten, QE has ended, inflation is soaring, the yield curve is inverting, and there is a major conflict in Europe disrupting global supply chains. Taking “the under” on the BLS expectations might be a prudent move.
Back to the Adjusted Numbers
Looking at the raw numbers is interesting and hints at what the BLS expects for the remainder of the year. That being said, the market at large and this analysis will focus primarily on the officially published numbers.
The chart below compares the current month with the 12-month average. All but two categories are below the 12-month trend. This indicates the job market is actually slowing some relative to recent history. With the economy fully reopened, is it possible the big job gains are in the rear-view mirror?
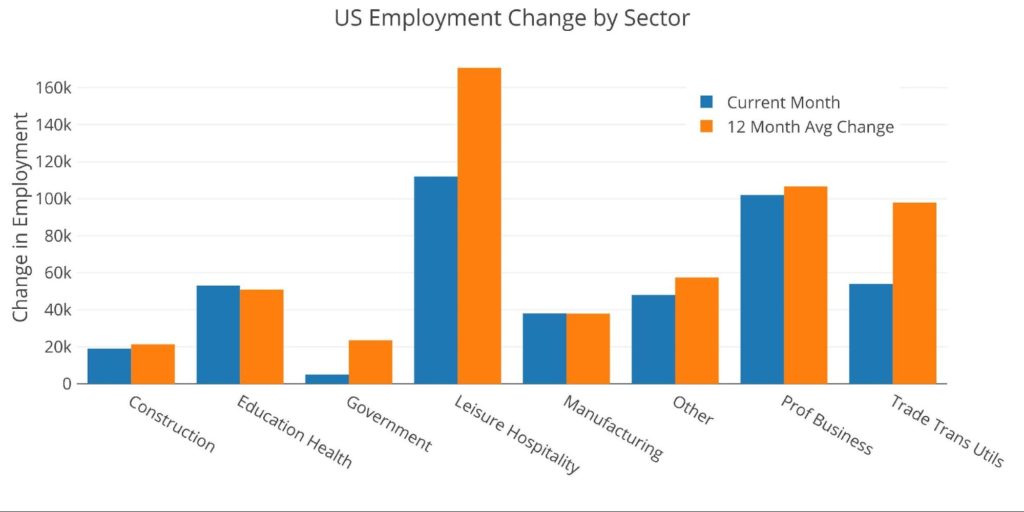
Figure: 5 Current vs TTM
The table below shows a detailed breakdown of the numbers. Similar to the 12-month trend, the current month is also below the 3-month trend in many categories.
- Leisure and Hospitality, Construction, and Trade/Transportation are all well below the 3-month average
- This is surprising given the economy opening up and the weather getting warmer
- Manufacturing and Professional Business did show strength relative to history
In aggregate, this month was 130k jobs below the 3-month trend and 110k below the 12-month trend.
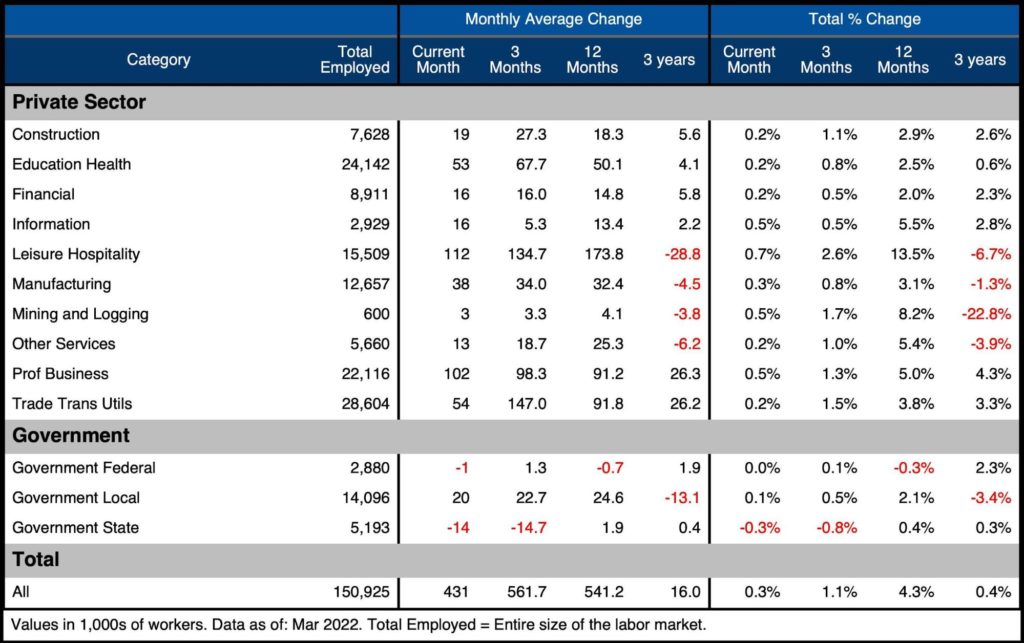
Figure: 6 Labor Market Detail
So, was March a strong report? Not really. It’s below the 12-month trend. Furthermore, the BLS is expecting stronger than average job growth this year. If that fails to materialize, March will have to be revised down in the months ahead.
Revisions
Revisions have moderated some after massive revisions over the last few months. From Dec-Feb, jobs have been revised up by an average of 166k per month. This is still more than 5 times higher than the 3-year average of 29k per month. Last month, the 3-month revisions were 10 times higher!
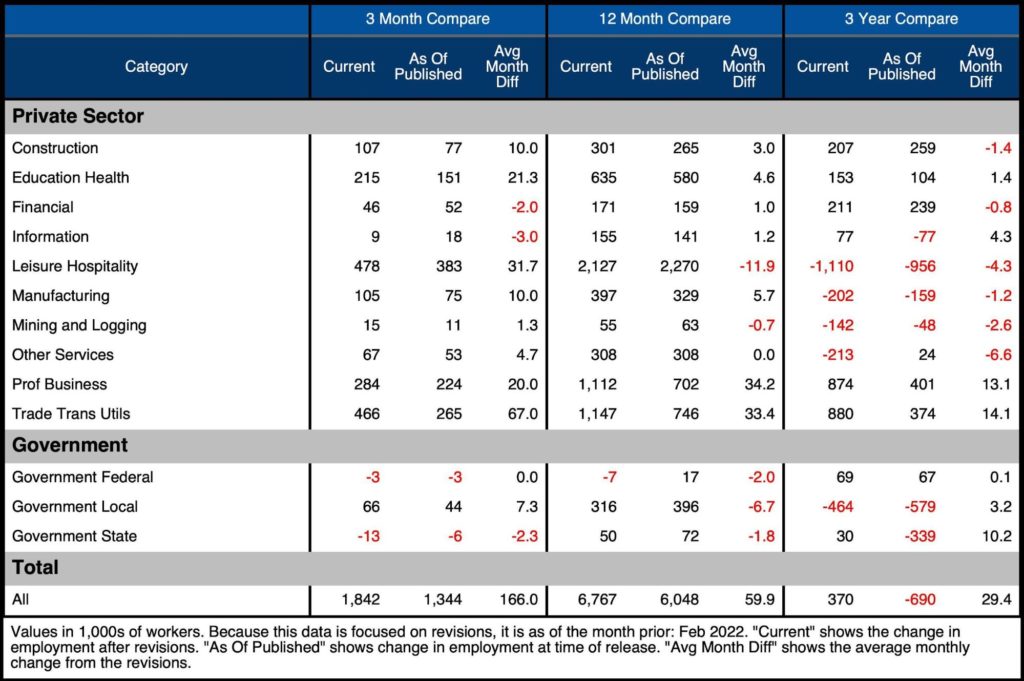
Figure: 7 Revisions
Historical Perspective
The chart below shows data going back to 1955. As the labor force has grown in total aggregate numbers, the recessions along the way have caused dips in the general trend. But the trend is still clearly upward.
The Covid recession can be seen as the greatest job market loss. The chart also shows how the rebound has been quite strong. There is still work to do, however. The job market had 152.5M people pre Covid and now sits at 150.9M. The job market is still 1.6M people short.
This does not consider the normal job growth that would have been seen over the last two years without Covid. With an average of 100k-200k new jobs in a healthy market, the market would have been several million jobs higher on a normal trajectory.
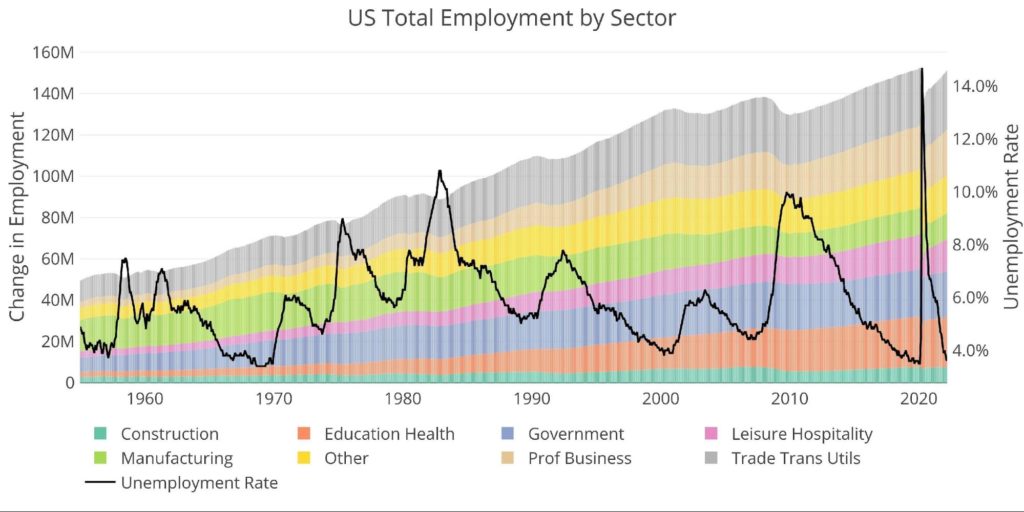
Figure: 8 Historical Labor Market
The distribution of the workforce has changed significantly over the last 65+ years. For example, in 1955, manufacturing accounted for 30% of jobs vs 8.4% today. Education/Health Care has tripled from 5% to 16%.
Although the unemployment rate has been sharply falling over the last year (chart above), the labor force participation (62.4%) is still below pre-pandemic levels (63.4%) and much lower than the 66% pre-financial crisis.
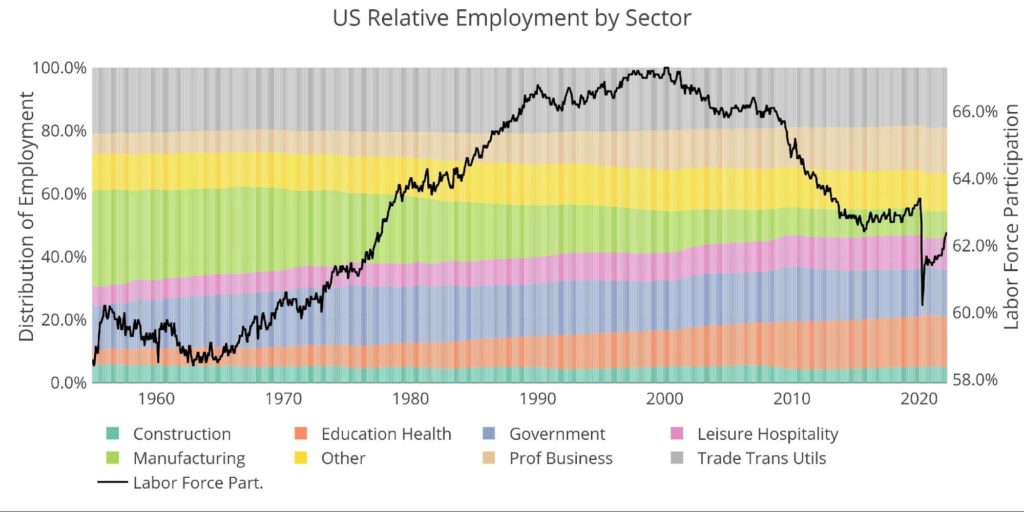
Figure: 9 Labor Market Distribution
What it means for Gold and Silver
The gold market is currently working to carve out new support ($1900) and resistance ($1950) zones once $1750-$1800 fell a few months ago. The current jobs number was mostly in-line with market expectations. Not strong enough to hurry the Fed along but not weak enough to slow them down.
That being said, the BLS is clearly expecting strong job growth to continue in the months ahead. The market is pricing in this expectation. This probably provides a solid floor beneath gold as all the potentially negative news is priced in. A quicker than anticipated resolution in Ukraine or a more aggressive Fed responding to higher-than-expected inflation could put downward pressure on prices.
On the flip side, there are multiple potential catalysts that could catapult gold higher at some point. Higher rates will pop the bubble economy, the dollar reserve status is under threat from China and Russia, while the Comex market continues flashing major warning signs.
If the job market rolls over and expected strength turns into weakness, the BLS will have to massively revise down job gains. If the assumptions in the BLS models have to change it could result in big job loss reports later this year. Then what does the Fed do?
Data Source: https://fred.stlouisfed.org/series/PAYEMS and also series CIVPART
Data Updated: Monthly on first Friday of the month
Last Updated: Mar 2022
Interactive charts and graphs can always be found on the Exploring Finance dashboard: https://exploringfinance.shinyapps.io/USDebt/

Call 1-888-GOLD-160 and speak with a Precious Metals Specialist today!
Buka akaun dagangan patuh syariah anda di Weltrade.
Source link