At the risk of boring you by repeating myself, now at this beginning of the new year and with the publication of my book Principles for Dealing with the Changing World Order, I want to concisely convey the most important thoughts I have about the paradigm we are now in, which is a result of how the world order appears to be changing. To be clear, while I express concerns and risks, I believe that we collectively have the power to manage our challenges well if we are smart and considerate with each other. Also, please know that I am not sure that any expectations I have are right. I’m just passing along my thinking for you to take or leave as you like.
MY CONCLUSIONS UP-FRONT
The world order is changing in important ways that have happened many times before in history, though not in our lifetimes. How the world order is changing has created the paradigm that we are in. By “paradigm,” I mean the environment that we are in. Paradigms typically last about 10 years, with occasional big corrections within them. They are driven by a persistent set of conditions that takes those conditions in a swing from one extreme to an opposite extreme. Because of this, each paradigm is more likely to be opposite than similar to the one before it. For example, the Roaring ’20s were followed by the depressionary 1930s, and the inflationary 1970s were followed by the disinflationary 1980s. The assets and liabilities that you would most like to have, and those that you would most like to avoid, change with the paradigm that exists at the time. For example, in the Roaring ’20s you’d want to own stocks and avoid bonds, while in the depressionary 1930s it would be the opposite; in the inflationary 1970s you’d want to own hard assets like gold and avoid bonds, while in the disinflationary 1980s you’d want to own financial assets and avoid hard assets.
For reasons explained in this report, I believe the current paradigm is a classic one that is characterized by the leading empire (the US) 1) spending a lot more money than it is earning and printing and taxing a lot, 2) having large wealth, values, and political gaps that are leading to significant internal conflict, and 3) being in decline relative to an emerging great power (China). The last time we saw this confluence of events was in the 1930-45 period, though the 1970-80 period was also analogous financially. In this piece, I will explain my reasoning and show charts that display these things happening. (For a much more comprehensive description, read Principles for Dealing with the Changing World Order.)
What should one do in this new paradigm? This paradigm is leading to a big shift in wealth and power. Naturally, as a global macroeconomic investor, the economic and market behaviors in this paradigm are top of mind. I think one should consider minimizing one’s ownership of cash and bonds in dollars, euros, and yen (and/or borrow in these) and putting funds into a highly diversified portfolio of assets, including stocks and inflation-hedge assets, especially in countries with healthy finances and well-educated and civil populations that have internal order. These things are especially important in this paradigm. In brief, I think one’s assets and liabilities should be well-balanced with minimum exposures to dollar, euro, and yen currency and debt assets. During this time, I also think it will pay to be short cash (i.e., borrow cash). Of course there will be corrections during the several years in the paradigm—for example, in central bank tightenings. But I don’t see any sustained period in which the government will likely allow cash returns to be better than the returns of a well-diversified, non-cash portfolio (e.g., All Weather) geared to the level of risk you’re comfortable with because that would cause terrible problems. These circumstances also have big geopolitical implications, which I will touch on here.
Now I will show you the reasoning behind my conclusions. Please do not just believe my conclusions because I don’t want you to blindly follow me. I urge you to challenge my reasoning and see how it goes. I hope the picture comes through clearly in the charts and text that follow.
THE FOLLOWING ARE THE THREE BIGGEST ISSUES THAT I WANT TO FOCUS ON
1) Big Debt and Debt Monetizations, Particularly in the World’s Leading Reserve Currency
2) Internal Conflicts over Wealth and Values Gaps
3) External Conflicts, Most Importantly the Rise of a Great Power (China) to Challenge the Existing Great Power (the US)
The confluence of these three issues is shaping the type of paradigm we are in. While I can’t cover them in depth in this brief report, I can hit the most important aspects of them, particularly of the debt/money/investment issue because that’s an area I have devoted my life to. All three issues transpire in cycles driven by cause/effect relationships that are logical and can be understood. It is important to understand how these cycles work and where we are in them.
1) BIG DEBT AND DEBT MONETIZATIONS
The three major reserve currency empires—the United States, Europe, and to a lesser extent Japan—are in poor financial shape. The top chart shows for the US how debt levels (black line) are high today and were high in the 1929-33 and 2008 periods. In both cases, interest rates hit 0% (blue line), and the printing of money and buying of financial assets began in a big way (red line). More recently, the COVID-triggered downturn and the political move to the left has led to a massive increase in debt creation and debt monetization in the US (and other countries). There is no doubt that this will continue even after COVID disappears, as large deficits that have to be monetized will exist. This makes everyone financially rich (i.e., they have a lot of money) and devalues money, which takes away much of this newfound wealth.

THIS PRINTING OF MONEY AND BUYING OF DEBT ASSETS HAS DRIVEN INTEREST RATES SO LOW THAT CASH AND BONDS ARE STUPID TO OWN
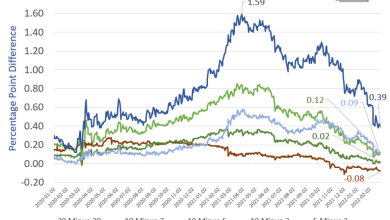
You aren’t getting an interest rate—why would you keep your money there? You are guaranteed to get lousy rates, particularly on cash. The charts below show that you are basically going to get the worst interest rates ever in both inflation-adjusted and nominal terms.

Think about the deal. The charts below [1] show the number of years it takes for the money one invests in bonds and cash to be returned before one starts making a profit. The one on the top left is in dollars and the one on the top right is in inflation-adjusted dollars. As shown, the amounts of time are between 50 years and never. This creates more incentive to sell and borrow this debt than to buy more. At the same time, a lot more debt will be produced and will have to be sold. There won’t be enough demand to buy it, especially since global investors are already overweight in it. The way this is dealt with is that the Fed prints a lot more money and buys a lot of debt.


REMEMBER THAT ONE PERSON’S DEBTS ARE ANOTHER PERSON’S ASSETS, AND IMAGINE WHAT WOULD HAPPEN IF THE ASSET HOLDERS SOLD BECAUSE THE DEBT ASSETS WERE UNATTRACTIVE (WHICH THEY ARE)
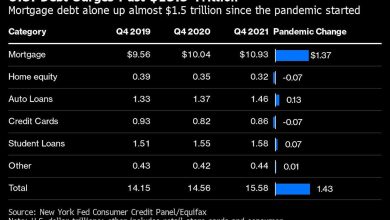
That would lead to either a big increase in interest rates or a huge increase in the printing of money to buy the debt to artificially hold interest rates down. The chart below [2] shows the amount of debt assets relative to GDP, which means that a lot can be sold if the holders lose their taste for it.

THE AMOUNT OF FINANCIAL ASSETS RELATIVE TO REAL ASSETS IS DANGEROUSLY HIGH, WHICH COULD LEAD TO A “BANK RUN”-TYPE MOVE FROM FINANCIAL ASSETS TO REAL ASSETS
I am not saying this will happen, but I am saying that there is a much higher probability of this happening than is reflected in market pricing. Think about it. There is only one purpose of investment assets, and that is to sell them to get cash to buy the real goods and services that one wants. Throughout history, whenever there were far more claims on real assets than there were real assets, a crisis eventually occurred when many holders of these financial assets went to sell them and discovered that there were far too many of them. That led to a “run on the bank”-type dynamic. Right now, there are vastly more financial assets than there are real assets, so if there was a move to convert them into real assets, that would lead to a “run on the bank”-type dynamic, which central banks would certainly respond to by printing a lot of money to allow people to get the money, but it would be of much less value.
Making financial asset prices go up by creating a lot of money and debt makes people financially richer, but it doesn’t make them actually richer. It also leads to periods of bad real returns. This is shown in the following charts [3]. The top chart shows financial asset values as a percentage of all assets, the second chart shows financial net worth relative to GDP, and the third chart shows rolling returns of the 60/40 stock/bond portfolio since 1910.

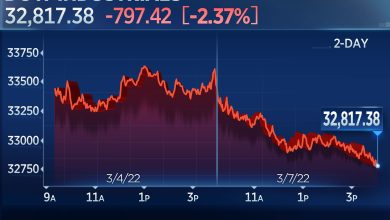
PERIODS LIKE THESE PRODUCE TERRIBLE RETURNS FOR HOLDING CASH
In my opinion, the four periods circled in the chart below [4] are the analogous periods to today, each of which produced analogous paradigms to what we’re experiencing.

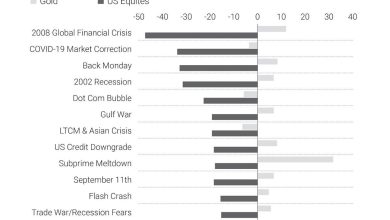
PERIODS LIKE THESE EVENTUALLY PRODUCE BAD REAL RETURNS FOR STOCKS AND BONDS [5]

2) INTERNAL CONFLICTS OVER WEALTH AND VALUES GAPS
In the US (and a number of other countries), wealth and income gaps are the largest since the 1930s.

AND THE POLITICAL GAPS ARE THE GREATEST EVER
This chart [6] shows that the US Republican Party (red lines) is more right-leaning and the US Democratic Party (blue lines) is more left-leaning than at any time since 1900, so the gap between them is enormous. There is great internal conflict going on in the United States now, which makes it a risky place. For example, it is entirely possible that neither side will accept losing the 2024 election. Such political clashes hurt productivity and create an inhospitable environment, which hurts capital flows.

GOVERNMENT SPENDING WILL INCREASE A LOT. TAX RATES WILL RISE A LOT, BUT NOT ENOUGH TO COVER THE SPENDING. SO WEALTH WILL BE REDISTRIBUTED THROUGH BOTH TAXES AND DEBT MONETIZATIONS.

3) EXTERNAL CONFLICTS DUE TO THE RISES AND DECLINES OF GREAT POWERS
The chart below shows indices of the strengths and weaknesses of the leading world powers since 1500. Note the Dutch, British, American, and Chinese cycles. The Dutch guilder was the world’s reserve currency when the Dutch Empire was on top, the British pound was the world’s reserve currency when the British Empire was on top, and the US dollar is the dominant reserve currency now that the US is on top. Note how things are changing. These cycles are transpiring for archetypical reasons.

This chart is a simplified version of what you just saw for these four empires. The gray shaded areas are the periods of great internal and external conflicts and restructurings via depression, revolution, and war (typically lasting 10-25 years). They are followed by more extended periods of peace and prosperity in which order is brought about by the existence of a dominant power that no country wants to fight because it’s too strong, leading people to work harmoniously together.

THE ARCHETYPICAL BIG CYCLE
I will begin taking you through the typical cycle at the point that the new order is created. After revolutions and wars a new order—i.e., a new system run by new leaders—is created. For example, the last world order to be created came after WWII, in 1945. At that point in the cycle there is a dominant power, and nobody wants to fight the dominant power, so this part of the cycle is typically peaceful and, if managed well, prosperous. It is economically rewarding, which leads people to borrow and bet on it continuing, leading to over-indebtedness. Because economic opportunities are naturally distributed unevenly, large wealth gaps develop. Also, with time, competitors emerge and grow in power. Over-indebtedness and declining competitiveness eventually lead to financial problems at the same time as there are large wealth and political gaps. This produces more internal conflict and people demanding more money, which leads governments to create more debt and print a lot more money, which weakens the currency and raises inflation. As the dominant power weakens and other powers get strong enough to challenge it, there are greater internal and external conflicts that lead to revolutionary changes in who has what wealth and power. That ends the old order and leads to the next new order. That is now happening.

As explained in my conclusions up-front, I believe that important wealth and power shifts are underway, creating a new paradigm in which 1) it is undesirable to hold dollar-, euro-, and yen-denominated credit assets, especially short-term debt assets, because they will have significantly negative real returns, and 2) it is desirable to hold a well-diversified portfolio of currencies, countries, and asset classes.
What I’ve given you above is an inadequately brief overview of that which is covered comprehensively in my book Principles for Dealing with the Changing World Order. If you are interested in this subject, I urge you to read it.
In the coming days, I’ll be sharing another update on what I’ll be watching for in 2022.
[1] Data shown in the ‘In Inflation-Adjusted Dollars’ chart is the latest available as of December 2020 [2] Estimated based on Bridgewater analysis. Please review the “Important Disclosers and Other Information” located at the end of this presentation. [3] Financial asset measures sourced from the World Inequality Database. Personal Financial Net Worth represents gross personal financial assets minus private debts. USA 60/40 refers to a portfolio with a 60% allocation to US equities and a 40% allocation to US government bonds. Please review the “Important Disclosures and Other Information” located at the end of this presentation. [4] Estimates are based on Bridgewater analysis. Please review the “Important Disclosures and Other Information” located at the end of this presentation. [5] 60/40 portfolio refers to a portfolio with a 60% allocation to the respective country’s equities and a 40% allocation to their bonds. Please review the “Important Disclosures and Other Information” located at the end of this presentation. [6] Based on data from voteview.com. Please review the “Important Disclosures and Other Information” located at the end of this presentation.Important Disclosures and Other Information
Please read carefully the following important disclosures and other information as they provide additional information relevant to understanding the assumptions, research and performance information presented herein. Additional information is available upon request except where the proprietary nature of the information precludes its dissemination.
IMPORTANT DISCLOSURES
This presentation contains proprietary information regarding Bridgewater Associates, LP (“Bridgewater”) and the strategies Bridgewater manages and is being furnished on a confidential basis to a sophisticated prospective investor for the purpose of evaluating an investment with Bridgewater. By accepting this presentation, the prospective investor agrees that it (and each employee, representative or other agent of such prospective investor) will use the information only to evaluate its potential interest in a fund or strategy described herein and for no other purpose and will not divulge any such information to any other party. No part of this presentation may be (i) copied, photocopied or duplicated in any form by any means or (ii) redistributed without the prior written consent of Bridgewater. Notwithstanding anything to the contrary, a prospective investor, and each employee, representative or other agent of such prospective investor, may disclose to any and all persons, without limitation of any kind, the U.S. federal and state income tax treatment and tax structure of a fund described herein (and any of the transactions contemplated hereby) and all materials of any kind (including opinions or other tax analyses) that are provided to a prospective investor relating to such U.S. federal and state income tax treatment and tax structure.
This presentation has been prepared solely for informational purposes and is not an offer to buy or sell or a solicitation of an offer to buy or sell any security or to participate in any trading strategy. Any such offering, will be made pursuant to a definitive offering memorandum (the “OM”) which will contain the terms and risks of making an investment with Bridgewater in the relevant fund and other material information not contained herein and which will supersede this information in its entirety. In the event of any discrepancy between the information shown in this presentation and the OM, the OM will prevail. Investors should not construe the contents of this presentation as legal, tax, accounting, investment or other advice. Any decision to invest in a Bridgewater fund or strategy described herein should be made after carefully reviewing the OM (including the risks described therein) and all other related documents, conducting such investigations as the prospective investor deems necessary and consulting such investor’s own investment, legal, accounting and tax advisors in order to make an independent determination of the suitability and consequences of an investment in such fund or strategy.
An investment in any Bridgewater fund or strategy involves significant risks and there can be no assurance that any fund or strategy will achieve its investment objective or any targets or that investors will receive any return of their capital. An investment in any Bridgewater fund or strategy is suitable only for sophisticated investors and requires the financial ability and willingness to accept the high risks inherent in such an investment (including the risk of loss of their entire investment) for an indefinite period of time. Past performance is not indicative of future results.
This presentation and the OM will only be made available to persons or entities who are “accredited investors” under the Securities Act of 1933, as amended, and “qualified purchasers” under the Investment Company Act of 1940, as amended. The distribution of this presentation and the OM may be restricted by law in certain jurisdictions, and it is the responsibility of persons into whose possession this presentation or the OM comes to inform themselves about, and observe, any such restrictions.
The shares in the fund may not be offered or sold to the public in Brazil. Accordingly, the shares in the fund have not been nor will be registered with the Brazilian Securities Commission – CVM nor have they been submitted to the foregoing agency for approval. Documents relating to the shares in the fund, as well as the information contained therein, may not be supplied to the public in Brazil, as the offering of shares in the fund is not a public offering of securities in Brazil, nor used in connection with any offer for subscription or sale of securities to the public in Brazil.
Certain information contained herein constitutes forward-looking statements (including projections, targets, hypotheticals, ratios, estimates, returns, performance, opinions, activity and other events contained or referenced herein), which can be identified by the use of terms such as “may,” “will,” “should,” “expect,” “anticipate,” “project,” “estimate,” “intend,” “continue” or “believe” or other variations (or the negatives thereof) thereof. Due to various risks, assumptions, uncertainties and actual events, including those discussed herein and in the OM, actual results, returns or performance may differ materially from those reflected or contemplated in such forward-looking statements. As a result, prospective investors should not rely on such forward-looking statements in making their investment decisions. Any forward-looking statements contained herein reflect Bridgewater’s current judgment and assumptions which may change in the future, and Bridgewater has no obligation to update or amend such forward-looking statements.
Bridgewater’s investment process seeks to understand the cause and effect linkages that drive markets over time. To assess and refine its understanding of these linkages, Bridgewater performs historical stress tests across a wide range of timeframes and market environments. From these stress tests, Bridgewater is able to simulate how its strategies would have performed prior to their inception. For strategies that include active decision making, Bridgewater often “humbles” its simulated alpha returns (by systematically adjusting downward the simulated results that Bridgewater’s current alpha investment logic produces) to account for the possibility that it could be wrong. Because this stress testing is a core component of Bridgewater’s investment process, it shares these simulations with current and prospective investors to demonstrate its thinking. However, because they do not demonstrate actual results, these simulations are inherently limited and should not be relied upon to make an investment decision.
HYPOTHETICAL PERFORMANCE RESULTS HAVE MANY INHERENT LIMITATIONS, SOME OF WHICH ARE DESCRIBED BELOW. NO REPRESENTATION IS BEING MADE THAT ANY ACCOUNT WILL OR IS LIKELY TO ACHIEVE PROFITS OR LOSSES SIMILAR TO THOSE SHOWN. IN FACT, THERE ARE FREQUENTLY SHARP DIFFERENCES BETWEEN HYPOTHETICAL PERFORMANCE RESULTS AND THE ACTUAL RESULTS SUBSEQUENTLY ACHIEVED BY ANY PARTICULAR TRADING PROGRAM.
ONE OF THE LIMITATIONS OF HYPOTHETICAL PERFORMANCE RESULTS IS THAT THEY ARE GENERALLY PREPARED WITH THE BENEFIT OF HINDSIGHT. IN ADDITION, HYPOTHETICAL TRADING DOES NOT INVOLVE FINANCIAL RISK, AND NO HYPOTHETICAL TRADING RECORD CAN COMPLETELY ACCOUNT FOR THE IMPACT OF FINANCIAL RISK IN ACTUAL TRADING. FOR EXAMPLE, THE ABILITY TO WITHSTAND LOSSES OR TO ADHERE TO A PARTICULAR TRADING PROGRAM IN SPITE OF TRADING LOSSES ARE MATERIAL POINTS WHICH CAN ALSO ADVERSELY AFFECT ACTUAL TRADING RESULTS. THERE ARE NUMEROUS OTHER FACTORS RELATED TO THE MARKETS IN GENERAL OR TO THE IMPLEMENTATION OF ANY SPECIFIC TRADING PROGRAM WHICH CANNOT BE FULLY ACCOUNTED FOR IN THE PREPARATION OF HYPOTHETICAL PERFORMANCE RESULTS AND ALL OF WHICH CAN ADVERSELY AFFECT ACTUAL TRADING RESULTS.
Bridgewater believes that a particular return stream should be evaluated against its expected performance or its benchmark. To that end, Bridgewater demonstrates whether its strategies are operating as expected via a cone chart, which shows the performance of a particular strategy over time relative to the strategy’s benchmark and also within bands of standard deviation from that benchmark. Separately, to demonstrate the impact of market conditions on the strategies it manages, Bridgewater explains the macro-economic pressures and market conditions that effected performance in the context of client letters, account reviews, or other publications that Bridgewater provides to each current and prospective investor on a regular basis. Additional information about how Bridgewater thinks about setting expectations for its strategies via a benchmark is available upon request.
Any tables, graphs or charts relating to past performance, whether hypothetical, simulated or actual, included in this presentation are intended only to illustrate the performance of indices, strategies, or specific accounts for the historical periods shown. When creating such tables, graphs and charts, Bridgewater may incorporate assumptions on trading, positions, transactions costs, market impact estimations and the benefit of hindsight. For example, transaction cost estimates used in simulations are based on historical measured costs and/or modeled costs, and attribution is derived from a process of attributing positions held at a point in time to specific market views and is inherently imprecise. Such tables, graphs and charts are not intended to predict future performance and should not be used as a basis for making any investment decision. Bridgewater has no obligation to update or amend such tables, graphs or charts.
Statements regarding target performance or target ratios related to assumed risk budgets, liabilities, volatility, target volatility, tracking error or other targets should not be considered a guarantee that such results can or will be achieved. For example, Bridgewater may adjust returns to match, for instance, the annualized standard deviation of two or more return series but this adjustment does not suggest that the returns or assets are similar with respect to other aspects of the risk such as liquidity risk. Any statements with respect to the ability to risk match or risk adjust in the future are not a guarantee that the realized risks will be similar and material divergences could occur. All performance and risk targets contained herein are subject to revision by Bridgewater and are provided solely as a guide to current targets.
Discussions related to the risk controlling capabilities of low risk portfolios, diversification, passive investing, risk management, risk adjusting, and any other risk control theories, statements, measures, calculations and policies contained herein should not be construed as a statement that Bridgewater has the ability to control all risk or that the investments or instruments discussed are low risk. Active trading comes with a monetary cost and high risk and there is no guarantee the cost of trading will not have a materially adverse impact on any account, fund, portfolio or other structure. Bridgewater manages accounts, funds and strategies not referred to herein. Additionally, even where accounts, funds or strategies are traded similarly, performance may materially diverge based on, among other factors, timing, the approved instruments, markets, and target risk for each strategy or market. The price and value of the investments referred to in this presentation and the income, if any, derived from there may fluctuate.
Statistical and mathematical measures of performance and risk measures based on past performance, market assumptions or any other input should not be relied upon as indicators of future results. While Bridgewater believes the assumptions and possible adjustments it may make in making the underlying calculations are reasonable, other assumptions, methodologies and adjustments could have been made that are reasonable and would result in materially different results, including materially lower results. Where shown, targeted performance and the abilities and capabilities of the active and passive management approaches discussed herein are based on Bridgewater’s analysis of market data, quantitative research of the underlying forces that influence asset classes as well as management policies and objectives, all of which are subject to change. The material contained herein may exhibit the potential for attractive returns, however it also involves a corresponding high degree of risk. Targeted performance, whether mathematically based or theoretical, is considered hypothetical and is subject to inherent limitations such as the impact of concurrent economic or geo-political elements, forces of nature, war and other factors not addressed in the analysis, such as lack of liquidity. There is no guarantee that the targeted performance for any fund or strategy shown herein can or will be achieved. A broad range of risk factors, individually or collectively, could cause a fund or strategy to fail to meet its investment objectives and/or targeted returns, volatilities or correlations.
Where shown, information related to markets traded may not necessarily indicate the actual historical or current strategies of Bridgewater. Markets listed may or may not be currently traded and are subject to change without notice. Markets used for illustrative purposes may not represent the universe of markets traded or results available and may not include actual trading results of Bridgewater. Other markets or trading, not shown herein, may have had materially different results. Attribution of performance or designation of markets and the analysis of performance or other performance with respect to scenario analysis or the determination of biases is based on Bridgewater’s analysis. Statements made with respect to the ability of Bridgewater, a fund, a strategy, a market or instrument to perform in relation to any other market, instrument or manager in absolute terms or in any specific manner in the future or any specified time period are not a guarantee of the desired or targeted result.
Bridgewater research utilizes data and information from public, private and internal sources, including data from actual Bridgewater trades. Sources include the Australian Bureau of Statistics, Bloomberg Finance L.P., Capital Economics, CBRE, Inc., CEIC Data Company Ltd., Consensus Economics Inc., Corelogic, Inc., CoStar Realty Information, Inc., CreditSights, Inc., Dealogic LLC, DTCC Data Repository (U.S.), LLC, Ecoanalitica, EPFR Global, Eurasia Group Ltd., European Money Markets Institute – EMMI, Evercore ISI, Factset Research Systems, Inc., The Financial Times Limited, GaveKal Research Ltd., Global Financial Data, Inc., Haver Analytics, Inc., ICE Data Derivatives, IHSMarkit, The Investment Funds Institute of Canada, International Energy Agency, Lombard Street Research, Mergent, Inc., Metals Focus Ltd, Moody’s Analytics, Inc., MSCI, Inc., National Bureau of Economic Research, Organisation for Economic Cooperation and Development, Pensions & Investments Research Center, Refinitiv, Renwood Realtytrac, LLC, Rystad Energy, Inc., S&P Global Market Intelligence Inc., Sentix Gmbh, Spears & Associates, Inc., State Street Bank and Trust Company, Sun Hung Kai Financial (UK), Totem Macro, United Nations, US Department of Commerce, Wind Information (Shanghai) Co Ltd, Wood Mackenzie Limited, World Bureau of Metal Statistics, and World Economic Forum. While we consider information from external sources to be reliable, we do not assume responsibility for its accuracy.
None of the information related to a fund or strategy that Bridgewater may provide is intended to form the basis for any investment decision with respect to any retirement plan’s assets. Any information Bridgewater provides should be independently and critically evaluated based on whatever other sources deemed appropriate, including legal and tax advice; it is also not intended to be impartial investment information or advice as Bridgewater may recommend one or more Bridgewater products in connection with such information, which would result in additional fees being paid to Bridgewater. Bridgewater’s status as an ERISA fiduciary with respect to the management of any existing or future Bridgewater product(s) in which you invest would be (or continue to be) set forth in that product’s applicable governing instruments. You are responsible for ensuring that your decision to invest in any Bridgewater product does not violate the fiduciary or prohibited transaction rules of ERISA, the U.S. Internal Revenue Code or any applicable laws or regulations that are similar. On and after June 9, 2017, the information provided herein is being made available only to “independent fiduciaries with financial expertise” (within the meaning of the Definition of the Term “Fiduciary”; Conflict of Interest Rule – Retirement Investment Advice, 81 Fed. Reg. 20,946 (Apr. 8, 2017), available at https://www.gpo.gov/fdsys/pkg/FR-2016-04-08/pdf/2016-07924.pdf), and this presentation should not be accepted by any person who does not meet such requirements.
This presentation was written in connection with the promotion or marketing of a Bridgewater fund or strategy, and it was not intended or written to be used and cannot be used by any person for the purpose of avoiding penalties that may be asserted under the U.S. Internal Revenue Code.
In certain instances amounts and percentages in this presentation are approximate and have been rounded for presentation purposes. Statements in this presentation are made as of the date appearing on this presentation unless otherwise indicated. Neither the delivery of this presentation or the OM shall at any time under any circumstances create an implication that the information contained herein is correct as of any time subsequent to such date. Bridgewater has no obligation to inform potential or existing investors when information herein becomes stale, deleted, modified or changed. ©2021 Bridgewater Associates, LP. All rights reserved.
Source link