Gold talking points:
- Gold prices have broken out from the longer-term setup but bulls haven’t been able to substantiate much for bullish trends beyond the 1900 level just yet.
- Longer-term charts highlight potential for reversal but shorter-term charts remain fairly messy. Strategy is discussed for both short and long-term vantage points below.
- The analysis contained in article relies on price action and chart formations. To learn more about price action or chart patterns, check out our DailyFX Education section.
Gold has been in the midst of some aggressive swings over the past few weeks and there’s a couple of prime reasons for why. While the Fed’s shift to a more-hawkish stance had acted as a pressure point for Gold prices, the recent rise of tensions on the Ukrainian border have propelled Gold up to some significant points of resistance, and as looked at a few weeks ago, the door was opening for an aggressive breach of the 1900 area on the chart.
That breakout happened shortly after and Gold bulls have been backing the bid ever since. This morning brings a bit of pullback following comments from Chair Powell, but taking a step back on the chart and we can see how some longer-term items of resistance have acted as a restraint to bullish continuation themes in Gold.
The price of 1923.70 remains relevant: This was the prior all-time-high in Gold and that remained as such for around nine years, until the 2020 breakout beyond the 2k level. It’s back in-play now on a shorter-term basis, which I’ll look at below.
Gold Monthly Price Chart
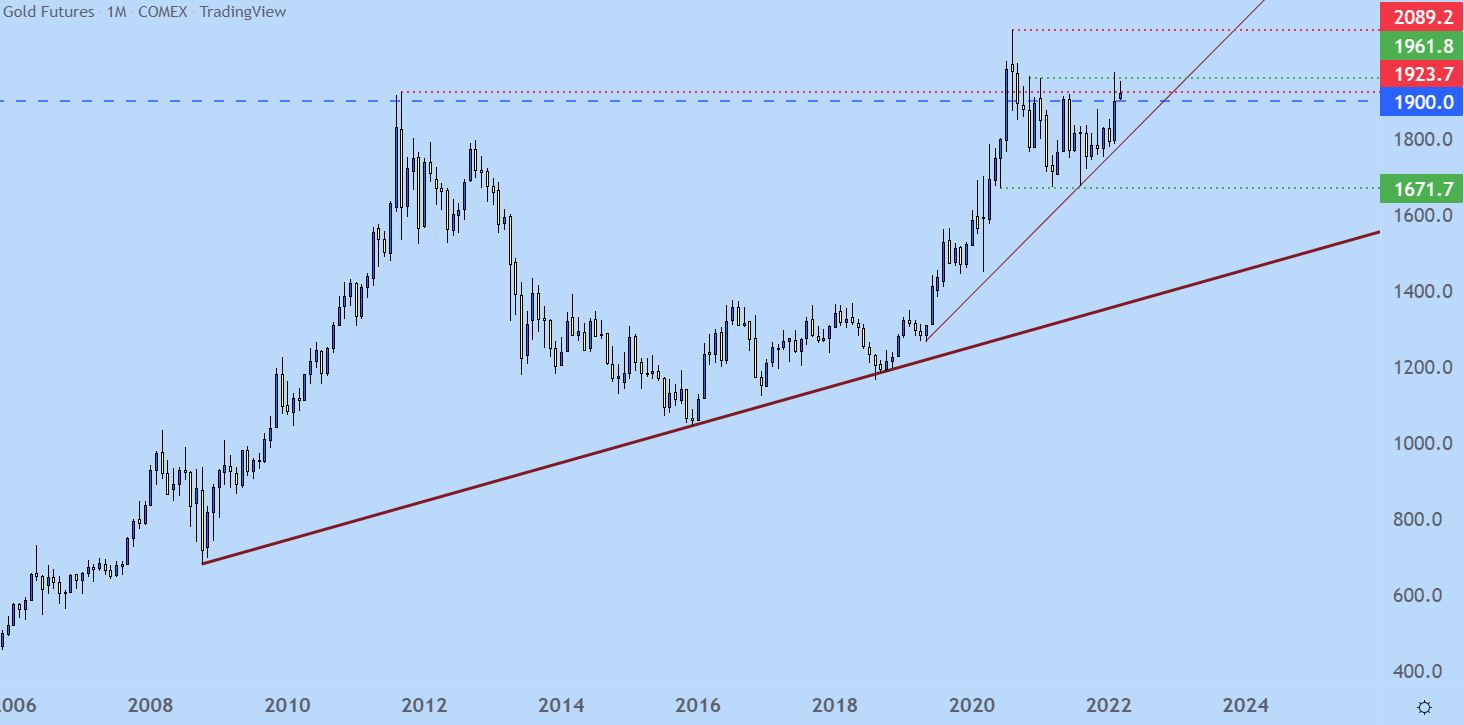
Chart prepared by James Stanley; Gold on Tradingview
Gold Shorter-Term, Dithering at 1900
From the weekly chart it becomes clear how Gold bulls may be somewhat disappointed in the move thus far. While there was initially a strong thrust beyond the 1900 level a couple weeks ago, there’s been a clear lack of follow-through beyond those highs.
And if we compare the move to oil or sync the move with what’s taking place in Ukraine right now, it doesn’t seem to fit. Oil prices went ballistic on the back of sanctions and the Russian invasion is only making the range of outcomes in Ukraine that much more opaque. That’s usually the kind of uncertainty that Gold bulls feast on but, as yet, they haven’t.
Last week’s candle closed as a shooting star, which could be indicative of reversals. So far this week Gold futures are working on a doji but there’ still half of the week to go with Non-farm Payrolls on Friday, so that’s certainly subject to change. But the shooting star last week, which may also be construed as a pin bar with the elongated wick ‘sticking out’ from prior price action may be highlighting possible reversal scenarios in Gold.
Gold Weekly Price Chart
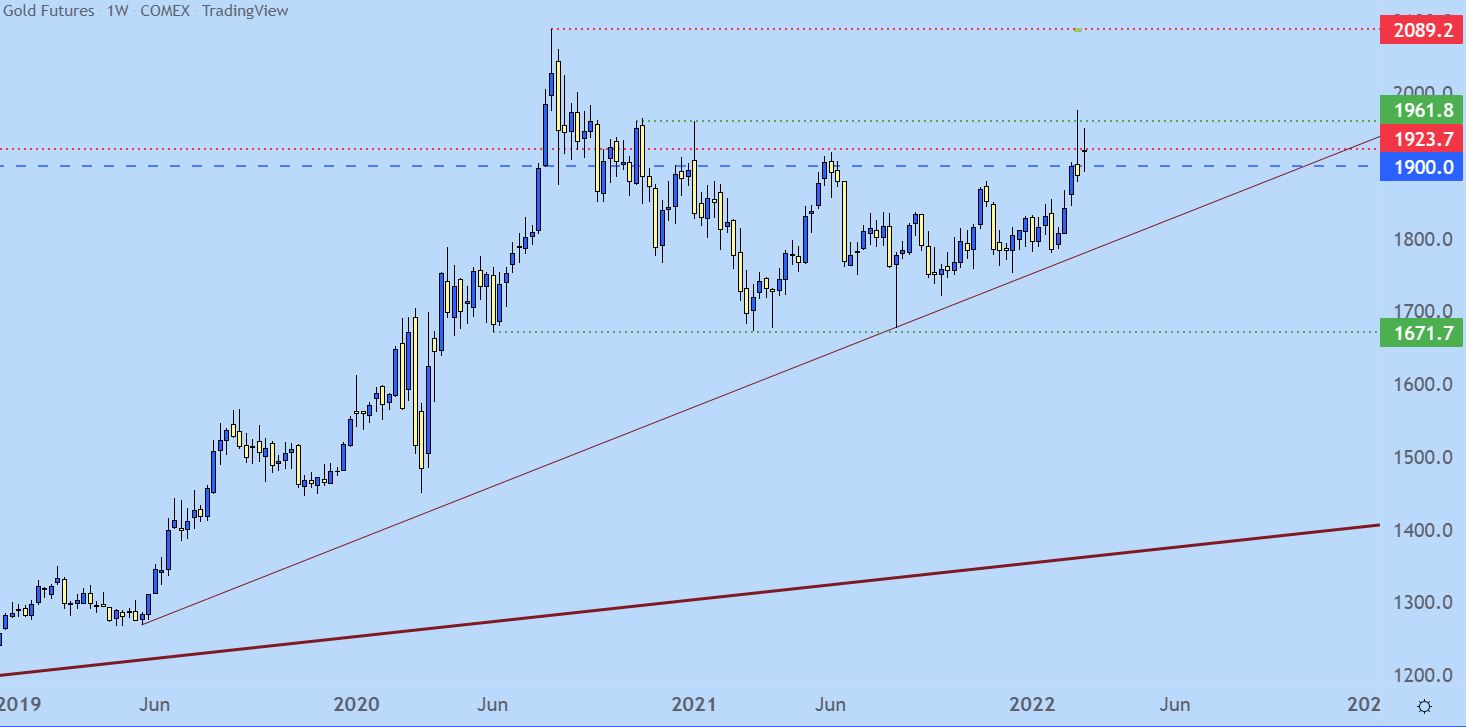
Chart prepared by James Stanley; Gold on Tradingview
Gold Short-Term
Gold on the daily chart and on lower time frames are a mess in my opinion and I think it’d be a challenge to try to gleam too much trend information from a market that’s exhibited such chaos. The one thing that’s clear from shorter time frames is the struggle that’s showed above the 1900 level and perhaps more to the point, the 1923.70 spot that was the prior all-time-high.
But, just because a market is volatile doesn’t mean that it’s unworkable; but it does often necessitate some adaptation since the probabilities of a trend continuing or a prevailing move running higher are lower with the inclusion of greater volatility.
This can keep the door open for support or resistance inflections, looking to utilize either mean-reversion or breakout logic. For the mean reversion, a support test at the 1900 level can keep the door open for longs. Or, for breakout scenarios, a push beyond the 1952 level can open the door for a run up to 1961, at which point a re-test of the 1976.5 high comes back into the equation.
On the bearish side, and looking to incorporate those longer-term views looked at above, a daily bar closing through the 1900 level can start to re-open the door for such scenarios, looking for greater reversal potential.
Gold Four-Hour Price Chart
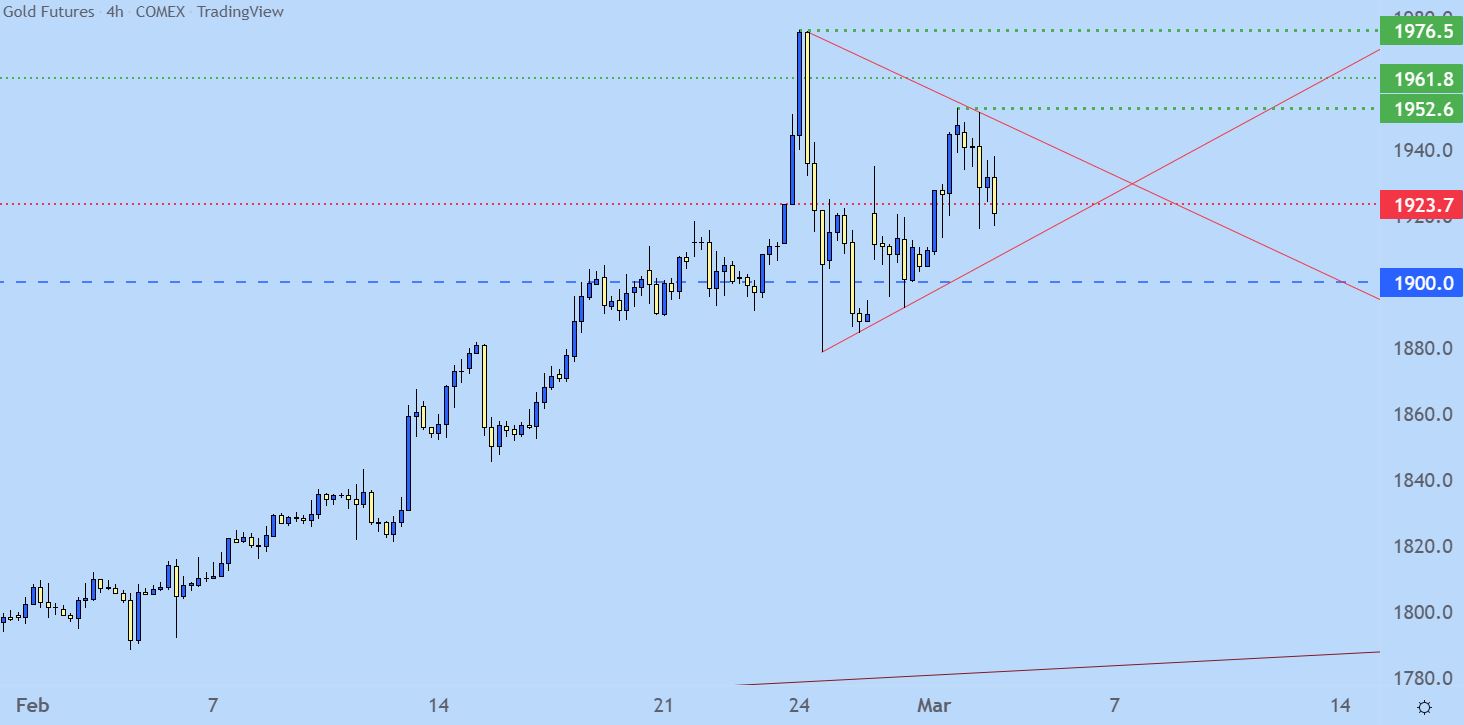
Chart prepared by James Stanley; Gold on Tradingview
— Written by James Stanley, Senior Strategist for DailyFX.com
Contact and follow James on Twitter: @JStanleyFX
Buka akaun dagangan patuh syariah anda di Weltrade.
Source link