Gold Talking Points:
- Gold prices have fallen by as much as -1.89% this morning on news that Russia was pulling troops back from the Ukrainian border. Notably, this news came from Russian sources and as of this writing, there hasn’t been confirmation from the U.S. side.
- Ahead of that news, Gold prices were strongly bid on their way up to fresh seven-month-highs, a clear sign of geopolitical tensions getting priced-in. But resistance played in at the same Fibonacci level that caught the November and H2 high in Gold last year. This can keep the door open for a fade of that recent bullish push in Gold prices.
- The analysis contained in article relies on price action and chart formations. To learn more about price action or chart patterns, check out our DailyFX Education section.
Over the past two weeks geopolitics have taken over Gold prices, namely the prospect of war on the Russia-Ukrainian border. Into yesterday, nine of the past eleven days have seen gains in Gold, with the yellow metal battering through a number of resistance levels along the way.
This was a change of pace for Gold, which had previously shown a modest bearish bias while being in an intermediate-term range. Longer-term held potential for a steeper drop, but that key support is all the way down in the 1680-1700 area so there wasn’t yet a fear of a bigger-picture move brewing just yet.
But, after a short-term low was set on January 28th, prices have gained as much as 5.53% on their way up to a fresh seven-month-high, which was set this morning just ahead of reports that Russia was pulling troops back from the border. That report led to a quick run of risk-on with stock prices jumping while the USD pulled back.
In Gold, that led to a steep drop during the European session that accounted for almost $36 of range, with an assist at resistance from the 50% marker of the 2020-2021 major move.
Gold Weekly Price Chart
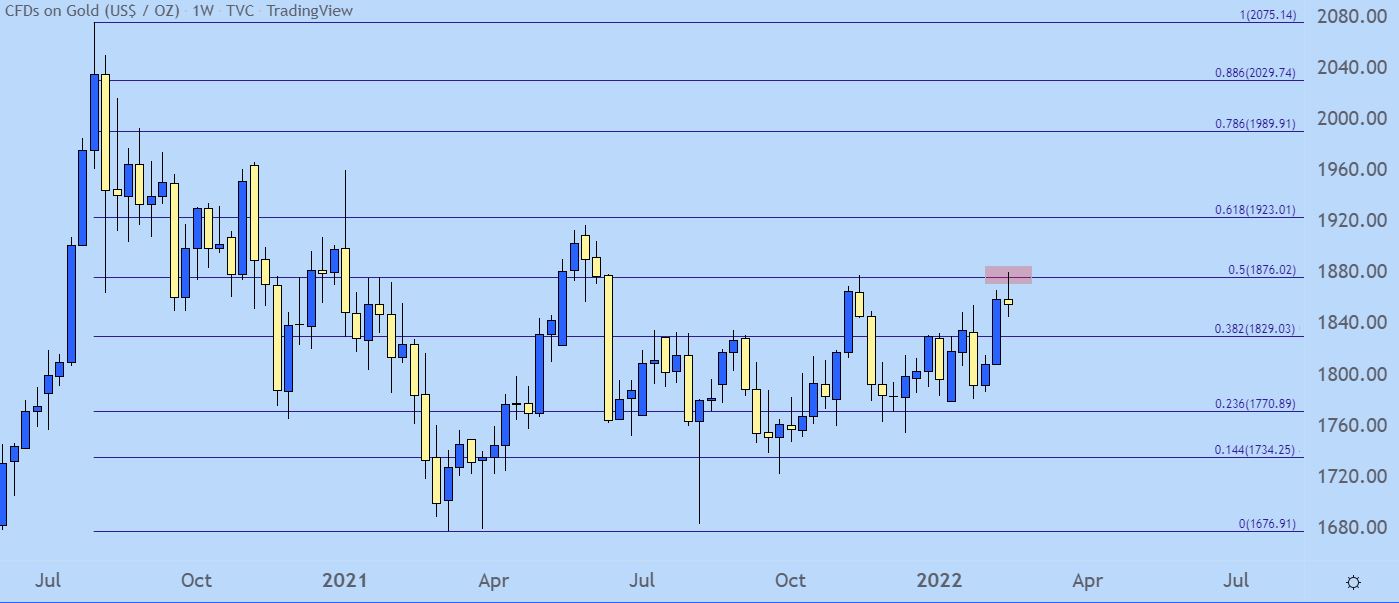
Chart prepared by James Stanley; Gold on Tradingview
Gold Shorter-Term
I’ve been bearish for some time on Gold and have had difficulty finding an adequate response to resistance to allow for bearish scenarios. And the reason for the price movement at this point really does appear to be driven by geopolitical tensions, which could equate to a continued pullback in Gold if tensions do de-escalate.
But, on the other side of that, if those reports are rebuked by U.S. sources today or if there’s further brinksmanship on the Ukrainian border, that bid in Gold could come rushing back.
But, at this point, I still like the prospect of fading this recent strength. The problem with given this morning’s price action is that the train has already pretty much left the station with Gold falling by almost 2% on news of Russia backing-off.
So, with that in mind, there’s really only two ways to proceed with bearish approaches: Either wait for a pullback to a lower-high level of resistance, or play the breakdown with breakout logic.
For the lower-high resistance potential, there’s two spots of interest on my chart: From the Fibonacci level at 1859 and the prior swing low around 1869. For the breakout scenario, the current low of 1843 could keep the door open for breakout approaches down towards the 1830/1832 zone. To learn more about breakouts, the link below will allow access to a guide discussing that specific style of market condition.
Gold Four-Hour Price Chart

Chart prepared by James Stanley; Gold on Tradingview
— Written by James Stanley, Senior Strategist for DailyFX.com
Contact and follow James on Twitter: @JStanleyFX
Buka akaun dagangan patuh syariah anda di Weltrade.
Source link