The difference between success and failure in Forex trading is very likely to depend mostly upon which currency pairs you choose to trade each week and in which direction, and not on the exact trading methods you might use to determine trade entries and exits.
When starting the trading week, it is a good idea to look at the big picture of what is developing in the market as a whole and how such developments and affected by macro fundamentals and market sentiment.
Big Picture 27th February 2022
Market sentiment is dominated by the Russian invasion of Ukraine which began last Thursday. As news of the invasion became clear, risk assets such as stock markets dropped sharply worldwide, while crude oil and other commodities strengthened to new multi-year highs, with gold also rising strongly. However, within a day, risk appetite recovered, stock market recovered their gains, and crude oil, gold, and other commodities gave up their strong gains.
Developments in the markets since Thursday suggest that markets are shrugging off the Russian invasion, possibly as it seems clear that NATO will not be likely to get involved, and that the Russians seem to be acting quite carefully so far, so as not to not inflict heavy civilian casualties. It seems clear that the Russian strategy was to go in lightly and hope that Ukrainian resistance would collapse quickly. This strategy has not worked well for the Russians, who have not been able to enter Kiev in strength, while their advance (except in southern Ukraine) seems bogged down. Ukraine has been able to put up a more effective defense than had been generally expected by analysts.

NATO countries and the EU have reacted by closing airspace to Russian aircraft, sanctioning Russian leaders and businesspersons, and removing certain Russian banks from the SWIFT payments system. These measures will certainly cause Russia economic damage, with the Ruble likely to end up artificially pegged by the Russian government to the Dollar and Euro when Forex markets open tomorrow. The Russian stock market lost almost half its value after news of the invasion broke before trading was suspended. However, it is noteworthy that the US and other allied nations are still buying Russian oil and trade with Russia is continuing. Nevertheless, these developments are likely to set a chill on Europe, and we saw the Euro weaken a little over the course of last week.
It should be noted that events in eastern Europe have the potential to worsen significantly and could lead to a clash between NATO and Russia which would almost certainly cause strong risk-off moves in markets.
Last week was the fifth consecutive week in which the number of new global confirmed coronavirus cases fell.
I wrote in my previous piece last week that the best trades for the week were likely to be long of Gold and Corn, also Soybeans following a close above $26.87. Gold fell by 0.42%, while the Teucrium Corn ETF fell by 1.68%, and the Teucrium Soybeans ETF fell by 3.97% after making a daily close above $26.87, so this gave an averaged loss of 2.02% for the week.
Fundamental Analysis & Market Sentiment
The headline takeaways from last week were, as mentioned, the Russian invasion of Ukraine and the initially successful Ukrainian defense, US Preliminary GDP data coming in as expected at an annualized rate of 7.0%, and the Reserve Bank of New Zealand hiking its interest rate as expected by 0.25% to a new rate of 1.00% and taking a more hawkish stance in its forecasted monetary policy.
Last week saw stock markets mostly fully recover from strong losses, while commodities sold off after spiking to new long-term highs. Markets seem to be shrugging off the Russian action in Ukraine, but markets remain unpredictable as the conflict goes on. Friday saw strong bullish momentum in the S&P 500 Index.
The coming week is likely to see a higher or similar level of volatility compared to last week, with the direction of markets unclear beyond a strong US Dollar. Additionally, there are a few economic data releases due this week, in order of importance:
- US Non-Farm Payrolls and Employment Change
- Bank of Canada Overnight Rate and Rate Statement
- Canadian GDP
- RBA Cash Rate & Rate Statement
- Australian GDP
- US ISM Manufacturing PMI
Last week saw the global number of confirmed new coronavirus cases fall again for the fifth consecutive week. Approximately 62.6% of the global population has now received at least one vaccination.
The strongest growths in new confirmed coronavirus cases overall right now are happening in Brunei, Burma, Cambodia, China, Iceland, South Korea, Malaysia, New Zealand, Singapore, Thailand, and Vietnam.
Technical Analysis
U.S. Dollar Index
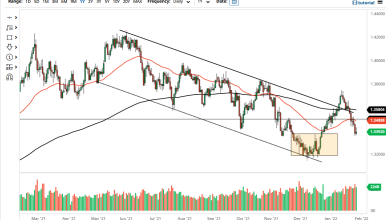
The weekly price chart below shows the U.S. Dollar Index printed a near-pin candlestick which was also technically a bullish engulfing candlestick last week, as the price continued its consolidation between the support level at 12174 and the resistance level at 12293. The price is obviously consolidating but there is still a long-term bullish trend in force, with the price higher than where it was 6 months ago, and just barely higher than it was 3 months ago which means the bullish trend is close to ending.
However, if the support level at 12174 continues to hold, the long-term bullish trend will be likely to resume.
Overall, it seems clear we still have bullish picture in the USD over the long and medium terms, but in the Forex market the greenback seems to not be the main driver of prices right now. It may be a better time to trade currency crosses not involving the USD.

US Dollar Index Weekly Chart
USD/JPY
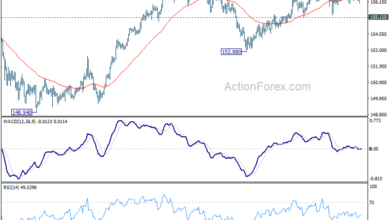
This major currency pair printed a bullish candlestock last week which ended the week at the highest weekly close for 5 years. The candlestick was also a bullish engulfing candlestick.
These are bullish signs, and the US Dollar is in a long-term bullish trend. However, it would be prudent to wait for a daily close above 116.13 to happen before entering a long trade here, as there is plenty of resistance between the current price and that level.
There may be better opportunities to be short of the weak Japanese Yen if risk sentiment continues to hold up, possibly by trading the AUD/JPY cross long.
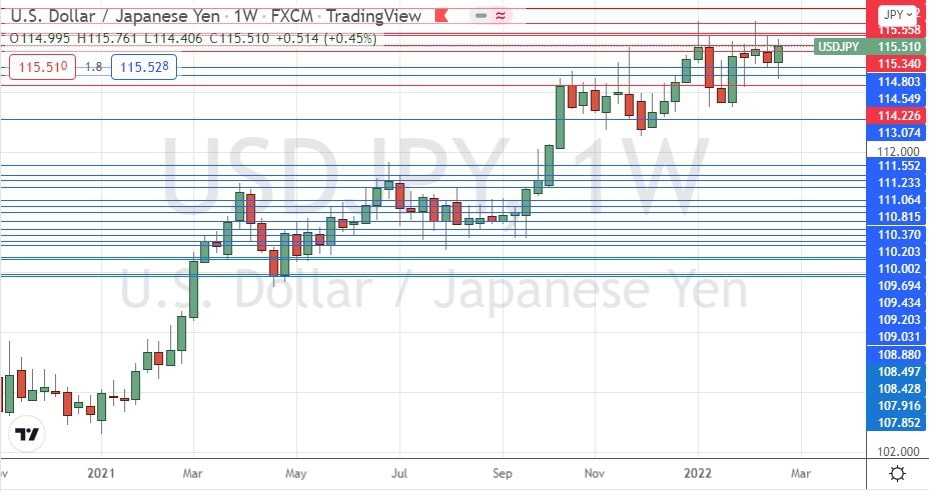
USD/JPY Weekly Chart
S&P 500 Index
This major US stock market index fell strongly upon news of the Russian invasion of Ukraine but then rebounded strongly within hours to end the week with all the week’s earlier losses recovered. However, despite the short-term bullish momentum, the price is trading well below the 200-day moving average, which is a bearish sign. Another bearish event on the horizon is the forthcoming “death cross” in which the 50-day moving average is highly likely to close below the 200-day moving average within the next couple of weeks.
It is difficult to predict how markets will behave this week, notably whether markets will continue to shrug off events in Ukraine, or whether there will be a worsening geopolitical situation in Europe which may begin to see price shocks similar to or even worse than what was seen last Thursday morning.

S&P 500 Index Daily Chart
Bottom Line
I see the best opportunities in the financial markets this week as likely to be long of the USD/JPY currency pair following a daily (New York) close above 116.13
Source link