Please note: the COTs report was published 2/25/2022 for the period ending 2/22/2022. “Managed Money” and “Hedge Funds” are used interchangeably.
The previous Commitment of Traders analysis showed how much influence Managed Money has over the short-term price movement of gold and silver. The table below summarizes this influence by comparing the Managed Money Net Positioning with “Other”, the next largest category. Swap is not considered because it typically sits opposite the other two.
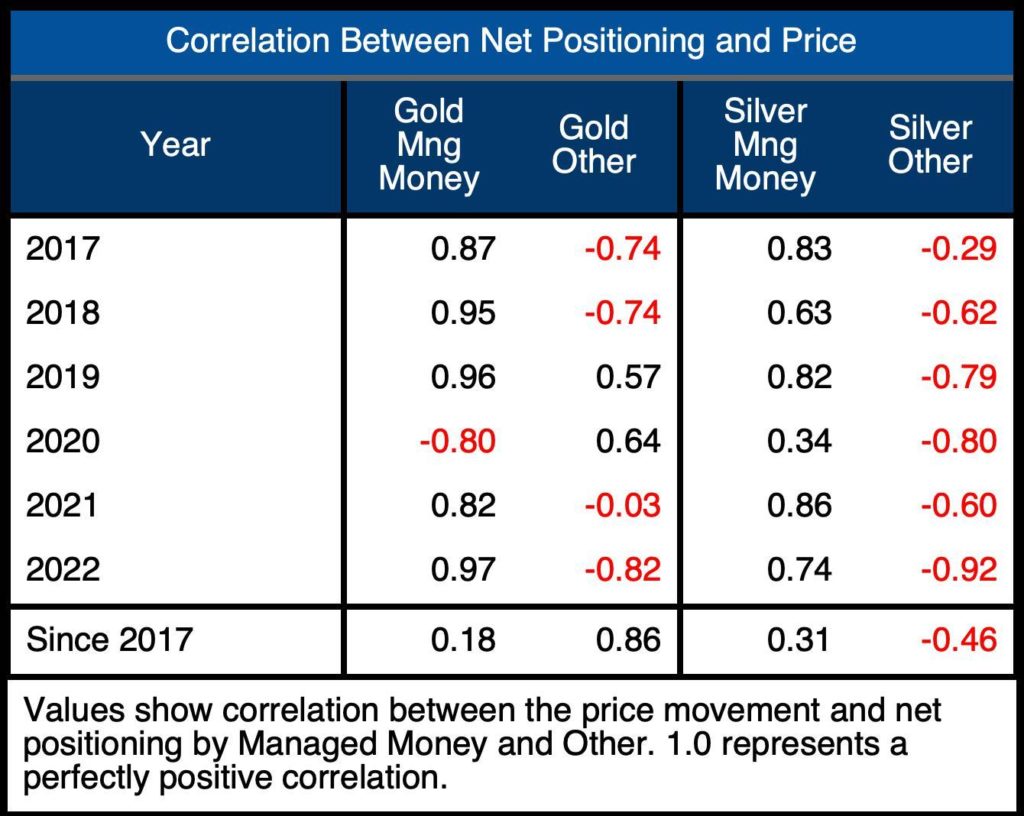
Figure: 1 Correlation Table
So far in 2022, Managed Money is showing a stronger correlation than ever before at a near-perfect .97. This compares to Other which is currently set at a very strong negative correlation of -.82. In silver, Managed Money is seeing a strong correlation of .74 vs Other which is seeing a Negative correlation of -.92!
Basically, these two parties have been betting exact opposite ways on precious metals this year and the Managed Money group (Hedge Funds) are completely dictating this market.
Gold
Current Trends
Over the last month, Managed Money Net Longs increased by nearly 30% or 37k contracts. Over the same time, Other has seen a 14k reduction or around 12.3%. Only in 2019 and 2020 was Other on the right side of the gold trade, increasing positions along with higher prices.
It’s possible that Other is taking profits as Hedge Funds pile in, but they were early in the move as gold has seen a very strong February.
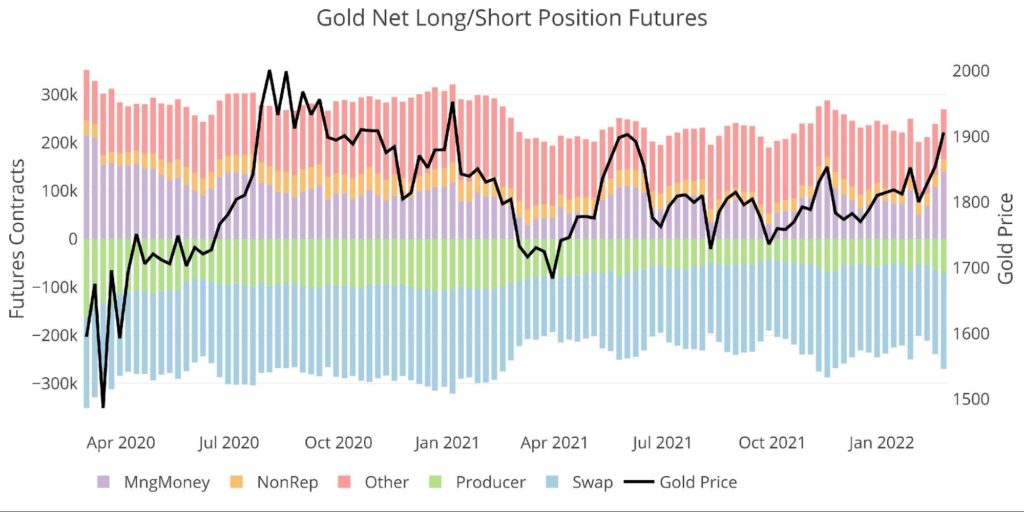
Figure: 2 Net Notional Position
Below shows a chart focused only on Managed Money. Over the past year, this has been hot money, jumping in and out quickly. This is responsible for the long consolidation pattern seen since late 2020. No price pop has been able to maintain as Managed Money is quick to bail at signs of trouble.
Gold has finally poked through major over-head resistance of $1880. While it did see a major pullback after jumping above $1970 on Thursday, it was able to hold above $1880 and close at $1890 for the week.
The coming weeks will show if Managed Money is finally bought in on this rally as they were in June 2019 or are preparing another quick exit. If this rally gets legs, it could really get going, similar to the 2019 rally where gold climbed 20% in 4 months.
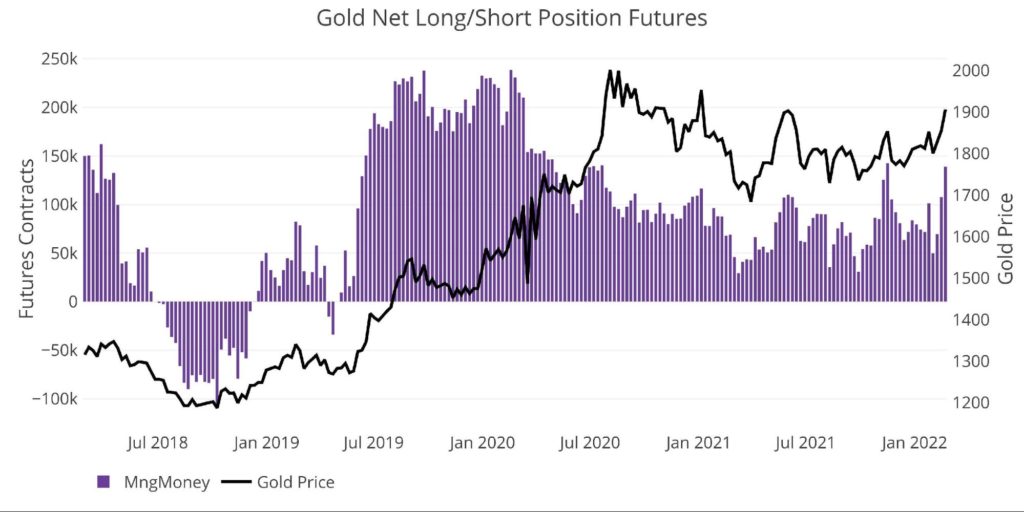
Figure: 3 Managed Money Net Notional Position
The chart above also highlights why recent price action has been so choppy. In past years, a steady direction was established in Maned Money net positioning. In the latest year, net positions were constantly bouncing up and down.
Weak Hands at Work
The chart below further highlights this trend, showing the week over week change for the past two years. The purple bars stick out with the erratic activity, constantly swinging from long to short. It is good to see three solid weeks of sustained buying in Managed Money in the most recent period. The data for the second half of this week won’t be available until next Friday, but it will probably show continued strength, even though the price fell so sharply on Thursday.
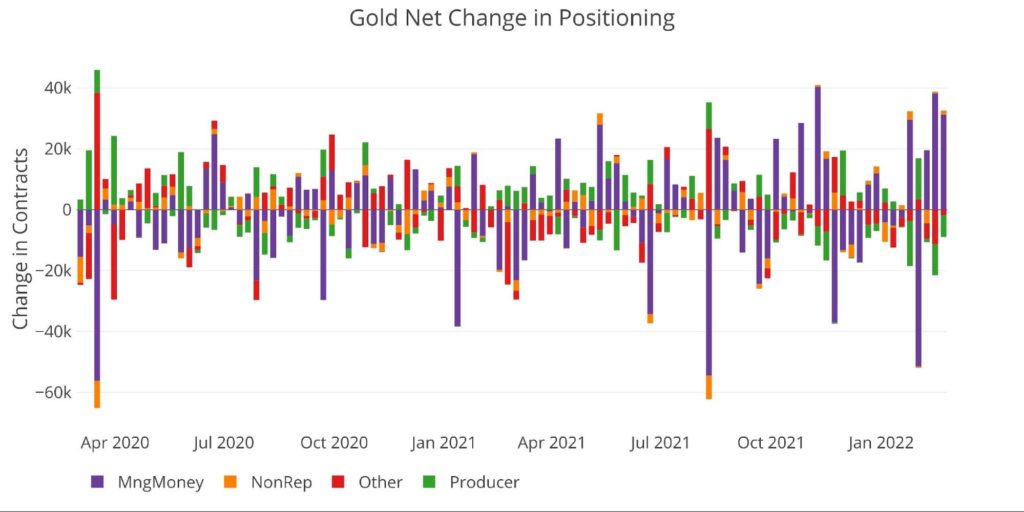
Figure: 4 Silver 50/200 DMA
The table below has detailed positioning information. A few things to highlight:
- Managed Money gross longs is the highest across all time periods, and 46.5% higher than a year ago
- Shorts have increased with longs over the month by 13%, climbing from 39k to 44k
- In the most recent week, Mgd Money increased by 29%, driving the price above $1900
- Other Gross Shorts is actually the largest ever
- Net Positioning in Other is still comfortable long, but there are parties that clearly don’t buy this current rally
Other is not used to being so high gross short. This could set up a dangerous short squeeze for them if the market continues to consolidate and move up.
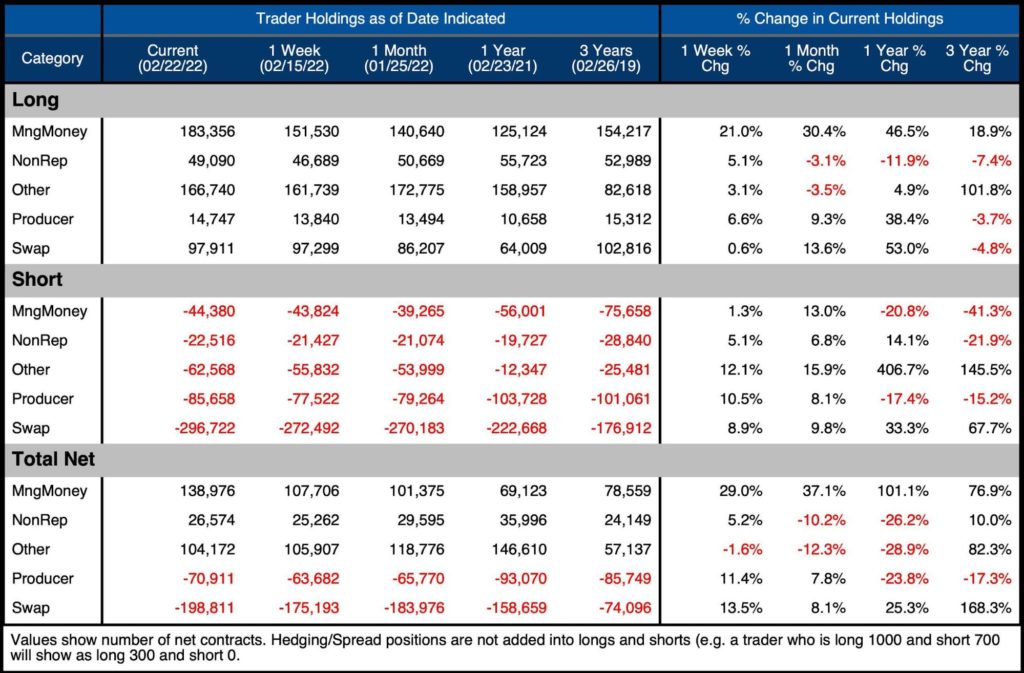
Figure: 5 Gold Summary Table
Historical Perspective
Looking over the full history of the COTs data by month produces the chart below (values are in dollar/notional amounts, not contracts). The chart shows the last run-up in price in 2011, followed by the slow fall into 2015 until the new bull market started in 2016.
This chart also shows how big the “Other” category has become on the long side. In 2011, Other Long had $8.6B in gross long vs $31.7B in the most recent period.
It should also be noted that total notional open interest is approaching $100B. Feb 2020 was the last (and only) time gold took a shot at $100B. If this market gets going, it could easily blow through that. Alternatively, traders might also get skittish and jump ship.
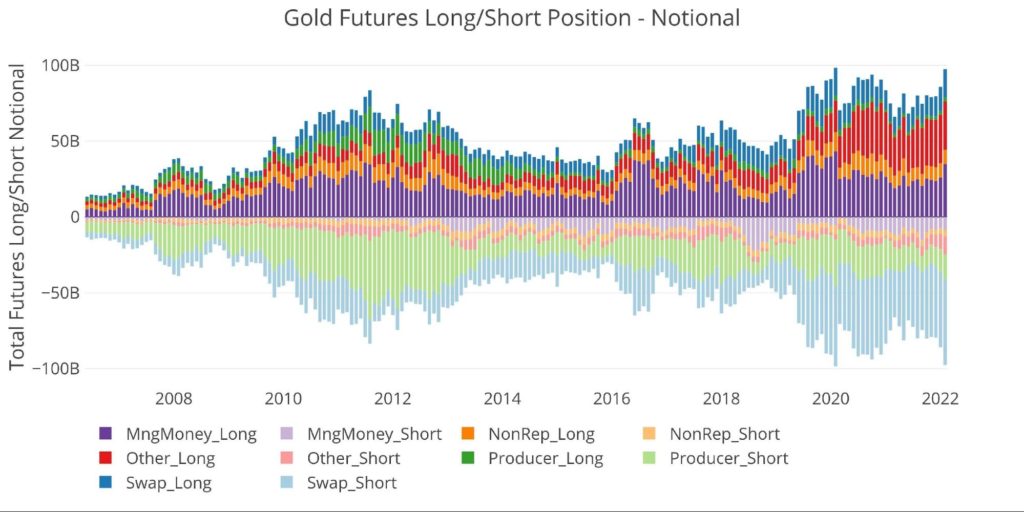
Figure: 6 Gross Open Interest
The CFTC also provides Options data. This has mainly been dominated by Producers, but recently Managed Money has played a larger role within the market. The current period shows Managed Money Longs increasing from $2.4B in November to $3.7B in February.
Other has dipped their toe back in the options market. Other has held no meaningful Long option position since 2016. They now hold $1.25B. This is the highest since they held $1.6B in Aug of 2011 when gold first made new all-time highs before a 10-year consolidation ensued. Hopefully, the current re-engagement is not a bad omen! Is it possible that Other is actually using short futures to hedge their long option contracts?
Options settlement happened this past Wednesday, so it will be interesting to see next week if Other stayed in the position through the expiration, holding farther dated contracts.
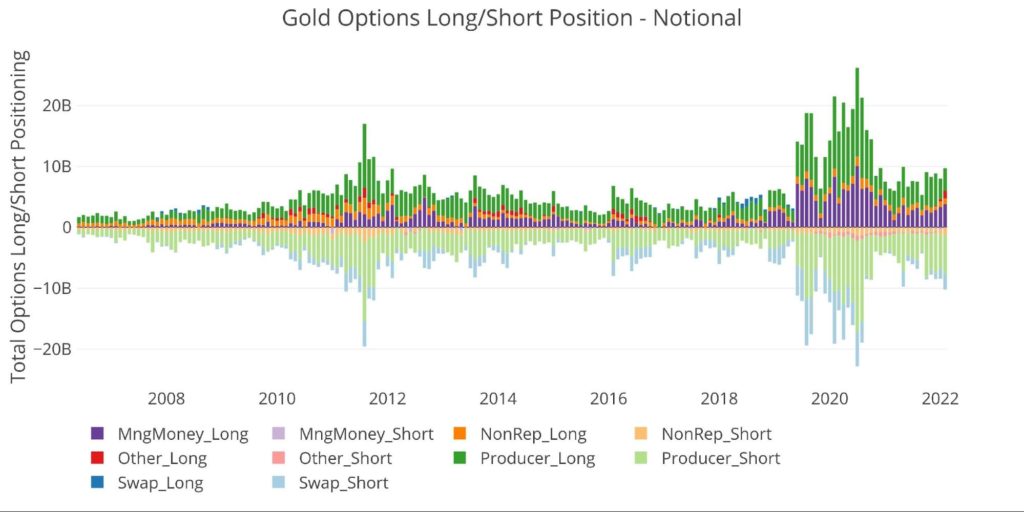
Figure: 7 Options Positions
The final chart below looks at net notional positioning against price on a longer time frame. As mentioned, while the correlation of managed money is strong, it is not perfect. The long-term bull market continues despite the volatile gyrations of managed money positioning.
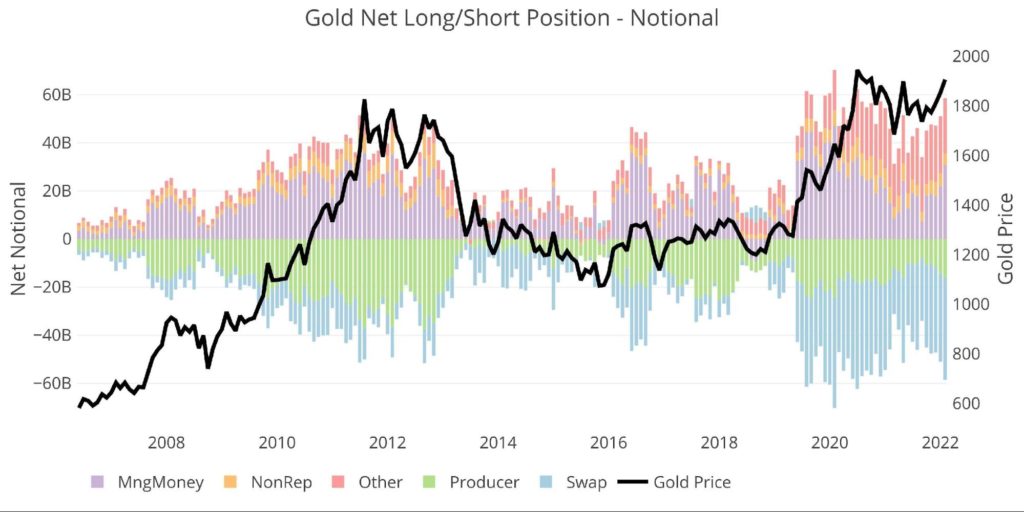
Figure: 8 Net Notional Position
Silver
Current Trends
Silver has also seen an increase in Managed Money net longs. In September, Net Longs hit the lowest level since June 2019. Surprisingly, Net Longs in Managed Money is below the November high, despite the price being below the November high. This indicates there is more room for Managed Money to increase their longs in silver before they get extended.
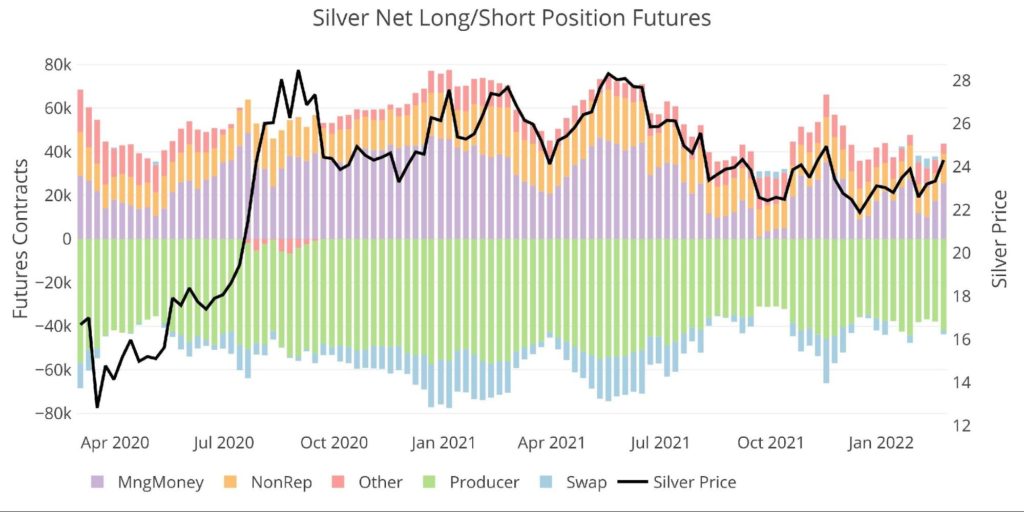
Figure: 9 Net Notional Position
The chart below shows how silver often lags gold. Silver has only seen two strong weeks of Managed Money increases vs the three seen in gold. This could also be from the Russia-Ukraine conflict and silver not always acting like a pure-play safe-haven.
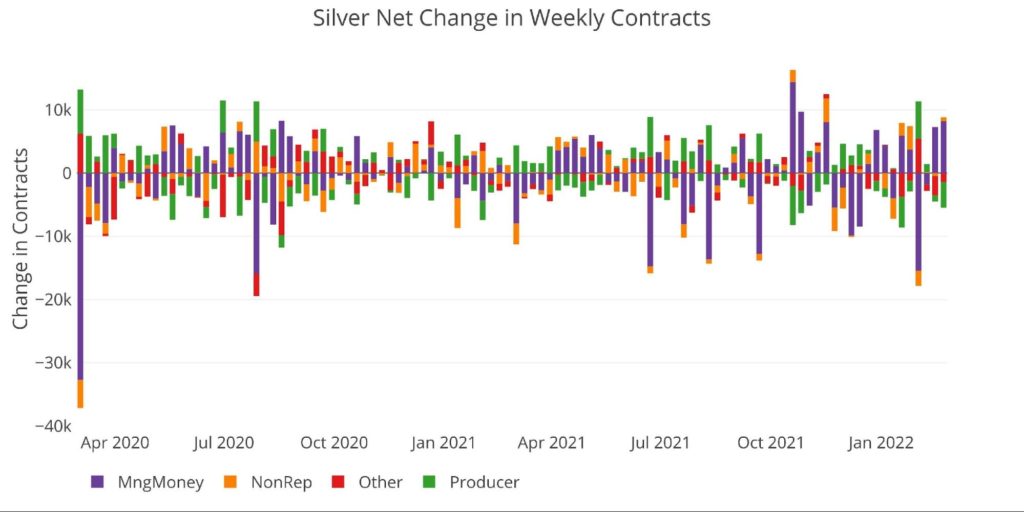
Figure: 10 Net Change in Positioning
The table below shows a series of snapshots in time. This data does NOT include options or hedging positions. Important data points to note:
- Managed Money Net Long MoM is actually down slightly (-6.5%)
- Shorts fell by 12% and longs by 9.5%. With Longs having a larger position, this resulted in a net decrease
- The last week saw a big recovery, with Net Longs increasing 47%
- Similar to gold, Other took the opportunity to sell into the price increase, dropping 2k contracts or 23.6%
- Swap went briefly positive last week before flipping back to Net Short
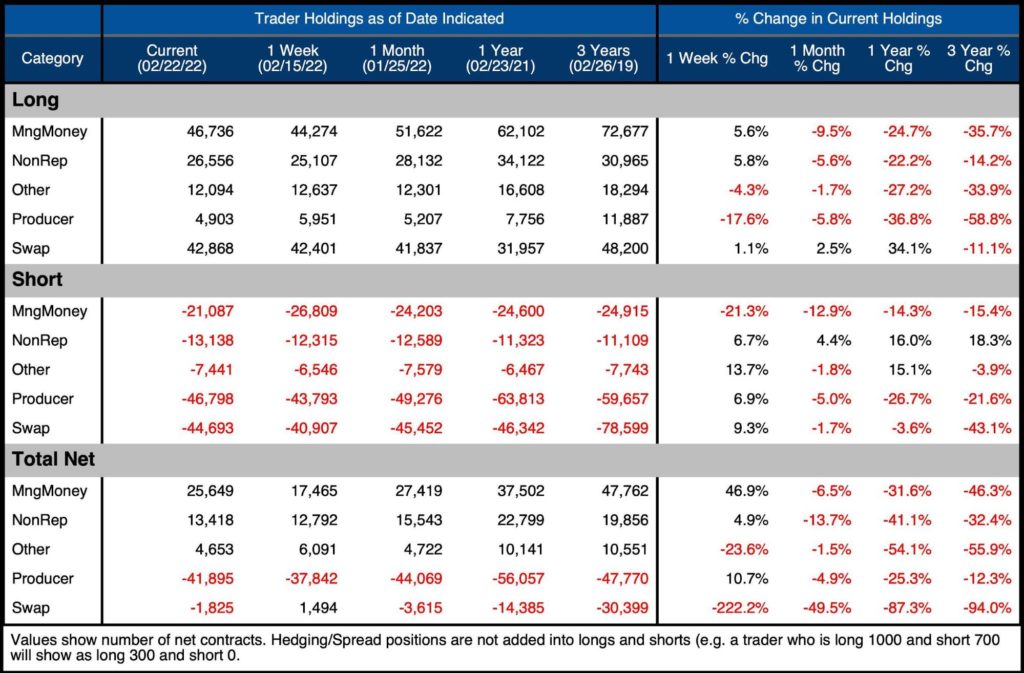
Figure: 11 Silver Summary Table
Historical Perspective
Looking over the full history of the COTs data by month produces the chart below. Even though silver is a more volatile metal than gold, this chart is surprisingly less volatile than the similar gold chart above.
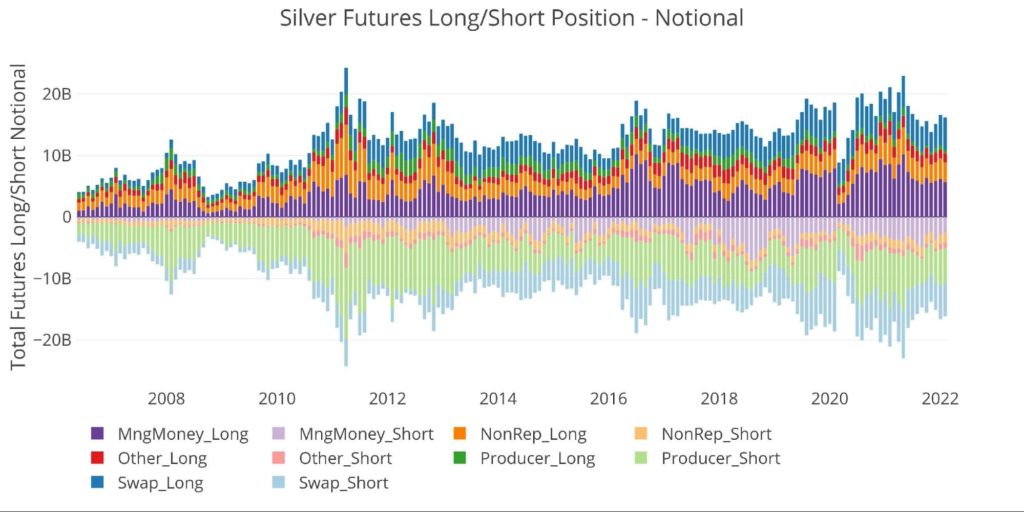
Figure: 12 Gross Open Interest
Also similar to gold, Other has inched its way back into the options market with $100m Long Contracts.
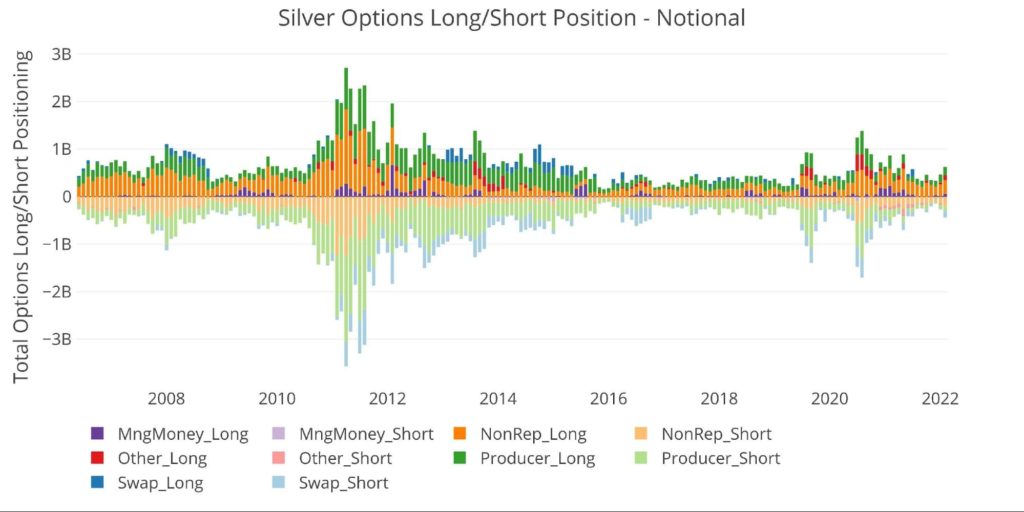
Figure: 13 Options Positions
Finally, looking at historical Net positioning shows the correlation of positioning with price. Similar to gold, the peaks and valleys in price are mirrored in the open interest.
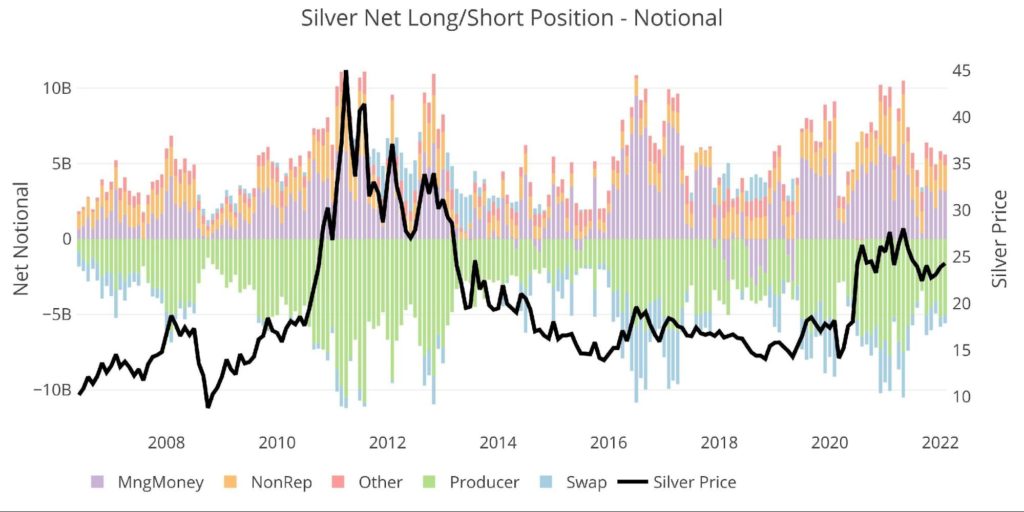
Figure: 14 Net Notional Position
Conclusion
Managed Money tends to push the price around, but the long-term bull markets in gold and silver persist under this activity.
Astute investors should keep the long-term picture in mind. The short-term gyrations can be immensely frustrating, but gold and silver are not Bitcoin. They are not vehicles to get rich quick because that would disqualify them as safe-havens. Remember, what goes up quickly, can come down quickly. Stay the course, trust the fundamentals, use the CFTC analysis to explain the short-term price movements, and understand the protection provided by physical precious metals.
Both PMs have seen solid price action over the last few weeks, breaking through resistance. The best action would be a rest and consolidation for a few weeks. Perhaps the next Fed meeting can be the event that pushes them back into recent highs. The traders will certainly be watching, and the CFTC will be reporting on their activity (on a 3-day lag!).
Data Source: https://www.cftc.gov/MarketReports/CommitmentsofTraders/index.htm
Data Updated: Every Friday at 3:30 PM as of Tuesday
Last Updated: Feb 22, 2022
Gold and Silver interactive charts and graphs can be found on the Exploring Finance dashboard: https://exploringfinance.shinyapps.io/goldsilver/

Call 1-888-GOLD-160 and speak with a Precious Metals Specialist today!
Buka akaun dagangan patuh syariah anda di Weltrade.
Source link