
This analysis focuses on gold and silver physical delivery on the Comex. See the article What is the Comex for more detail.
The last article highlighted the strange things going on in the gold market. Specifically:
- Cash settlement instead of delivery for February
- Increased open interest in March
- Slightly higher spread cost in April.
The warning signs have gotten a little bigger over the last few weeks as shown below. Gold has moved quickly to challenge a new major resistance at $1900. While most of this could be attributed to Ukraine, the market has been bubbling under the surface for several weeks as highlighted in previous articles. Ukraine may settle down or gold could back off $1900 on its own. However, the current trends show underlying strength that should keep a floor under the price in the weeks ahead unless these trends reverse.
First, a look at silver…
Silver: Recent Delivery Month
Silver is currently dealing with back-to-back minor months. At First Position, open interest was well below normal. Another strong month of mid-month net new contracts has led to a modest February. Below shows 1,278 contracts delivered with 390 still open. This will bring the February total above November, but short of January.
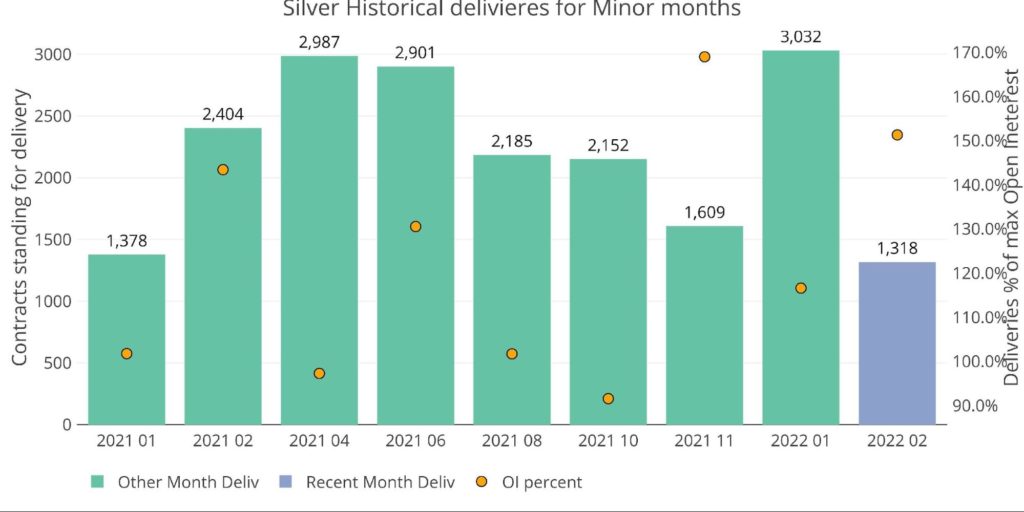
Figure: 1 Recent like-month delivery volume
As shown below, February is showing very modest delivery, especially when compared to the major months.
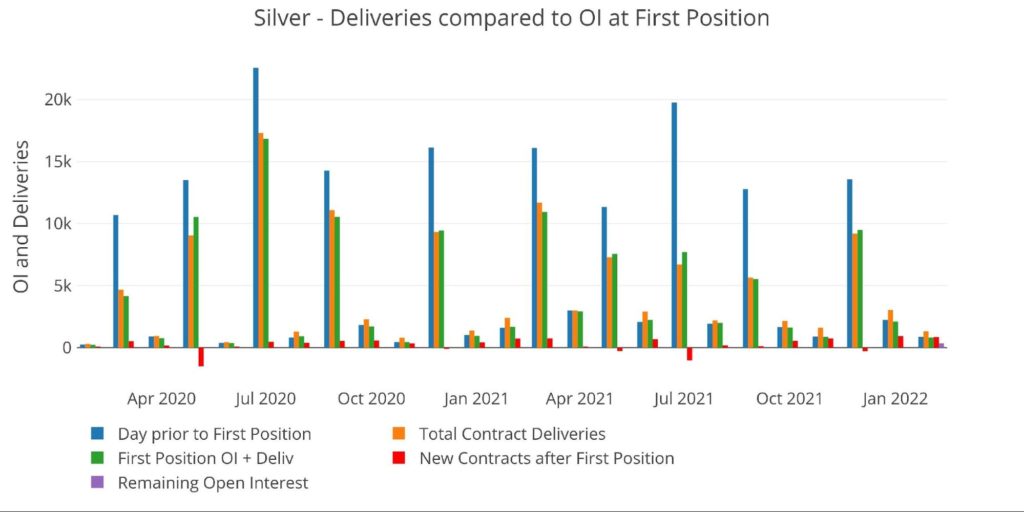
Figure: 2 24-month delivery and first notice
Surprisingly, net new contracts are the highest it has been 14 days after First Position. The red line below shows how many contracts have opened for immediate delivery. Net new contracts are currently above the activity in January, which ended up being a record.
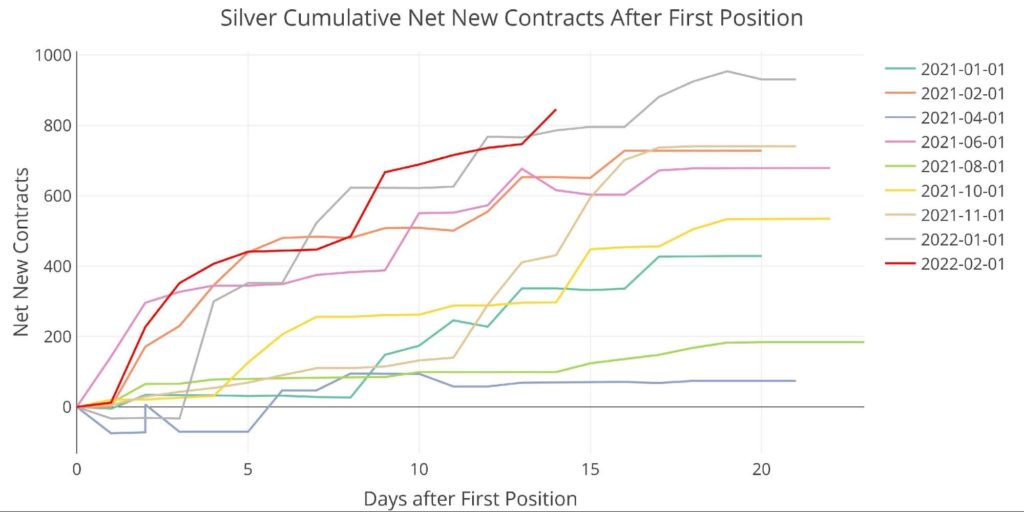
Figure: 3 Cumulative Net New Contracts
Looking at the house account activity shows that BofA has slowed its purchases compared to a very aggressive February. It also shows a modest net outflow across house accounts for February.
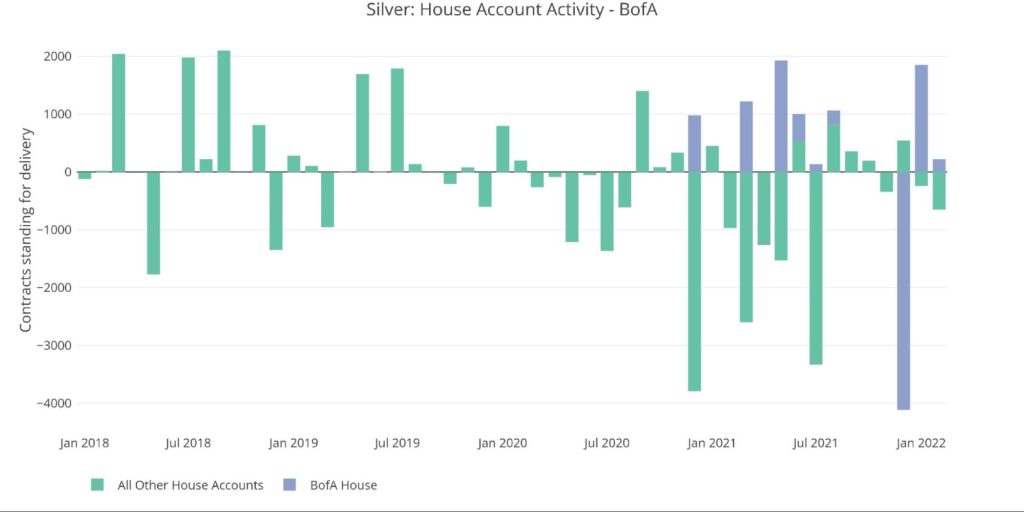
Figure: 4 House Account Activity
February is a historically slow month. Last February occurred in line with the Reddit silver squeeze which drove volume in physical and increased deliveries. Removing that month, the only other larger notional delivery amount in February occurred back in 2012 when prices were much higher. With 350 contracts remaining open, this February will likely be the second biggest on record.
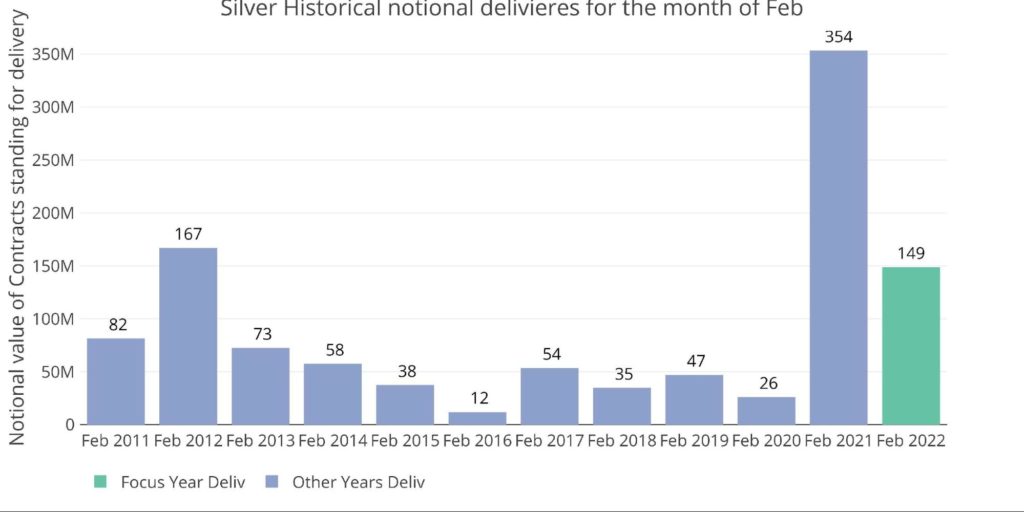
Figure: 5 Notional Deliveries
Silver: Next Delivery Month
Unlike gold, the next delivery month in silver is looking quite normal. Open interest is falling into the close.
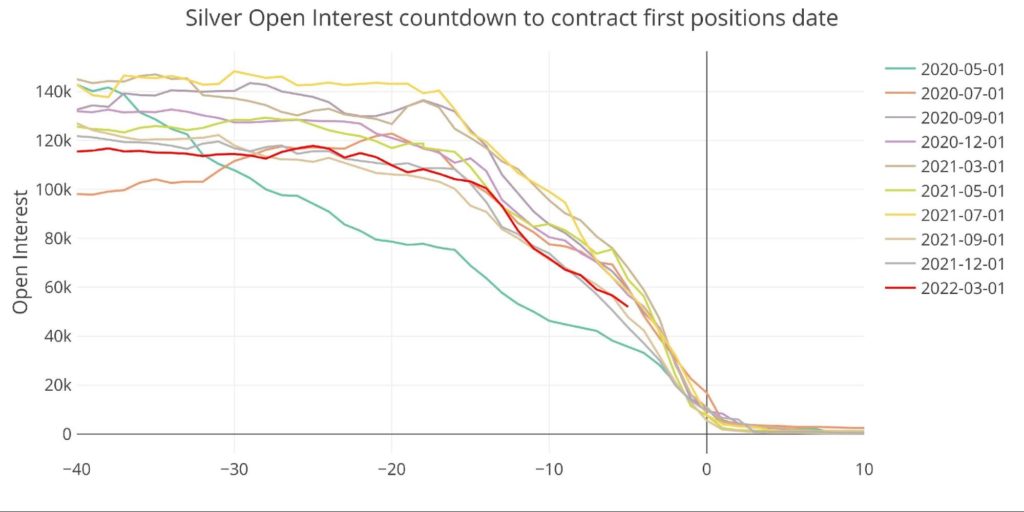
Figure: 6 Open Interest Countdown
The spread between the current March contract and the next major month (May) is also well within an average range. Everything looks fairly normal in silver, but gold is a different story.
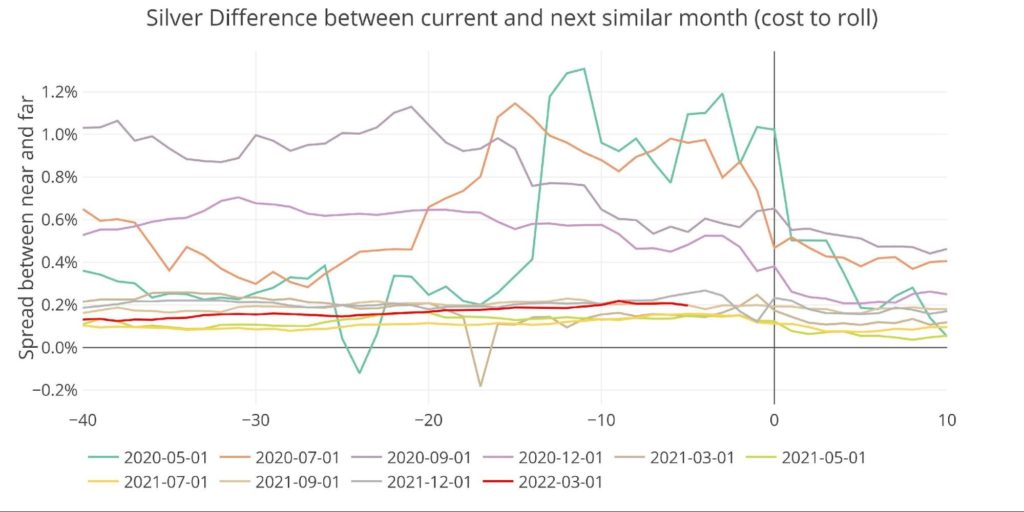
Figure: 7 Roll Cost
Gold: Recent Delivery Month
There are more charts than normal in this section to show some of the outlier trends occurring within gold.
February is a major month in gold. It is currently the smallest delivery month going back a year and a half. Even with the large open interest outstanding (1,413 contracts), this February may exceed October if those contracts stand for delivery.
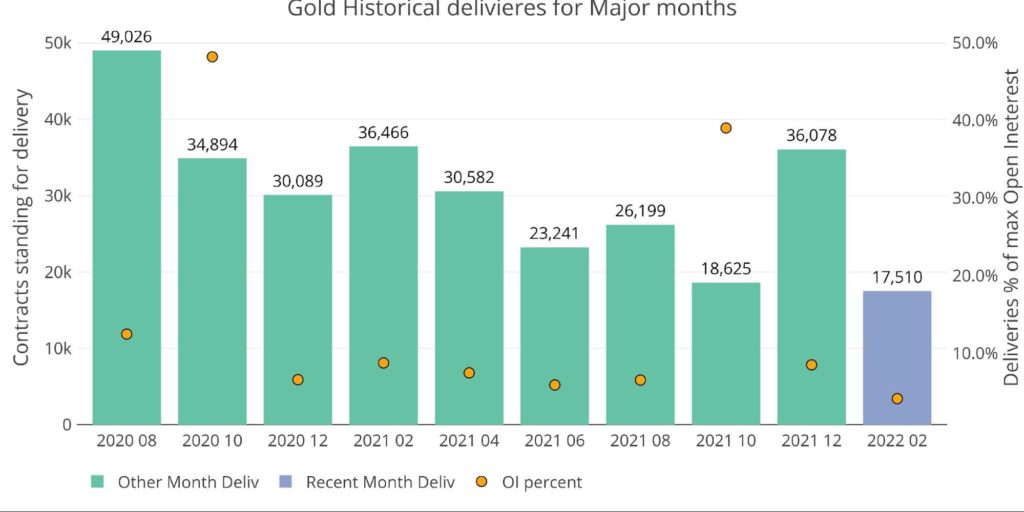
Figure: 8 Recent like-month delivery volume
The purple bar on the far right in the chart below represents current open interest (1,413 contracts).
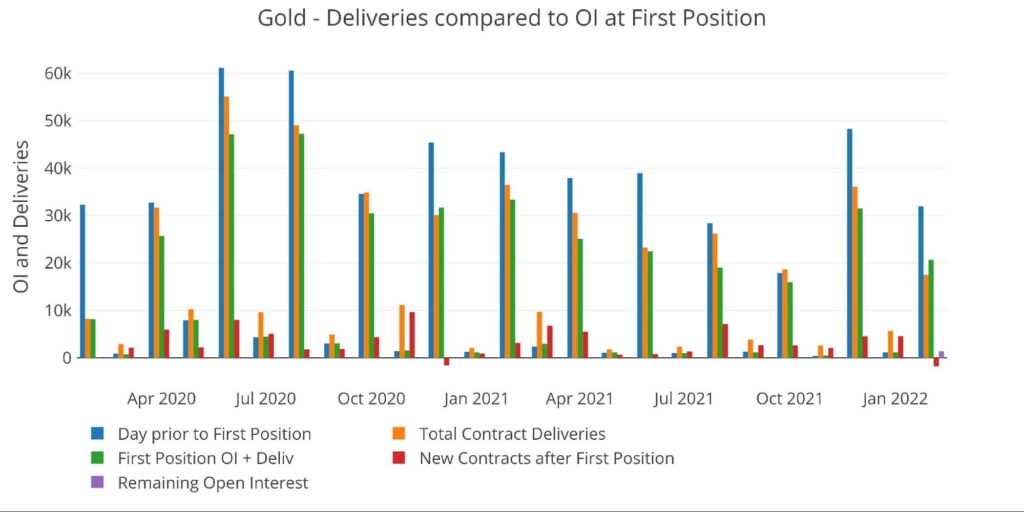
Figure: 9 Gold Deliveries
Why have these contracts not been settled yet? Is this abnormal?
The next two charts shed light on how much this month differs from normal months. The first chart looks at open interest delivered as a percentage of contracts open on First Position. The current amount sits at 84.4%. This is the lowest amount on Day 11 since Dec 2020 stood at 77%. It’s also held surprisingly constant over the last several days.
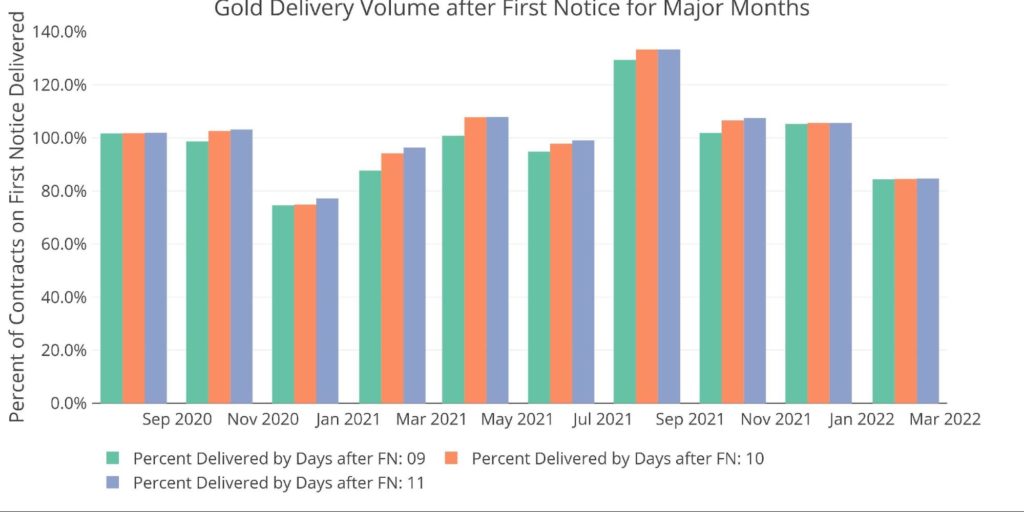
Figure: 10 Gold Delivery Volume
The chart below looks at a similar analysis but shows the aggregate number of contracts outstanding in the days after First Position. This makes the current month look less like an outlier from an aggregate perspective, but also shows how little activity there has been over several days. The red line below is incredibly flat compared to other months… as if there is simply no activity.
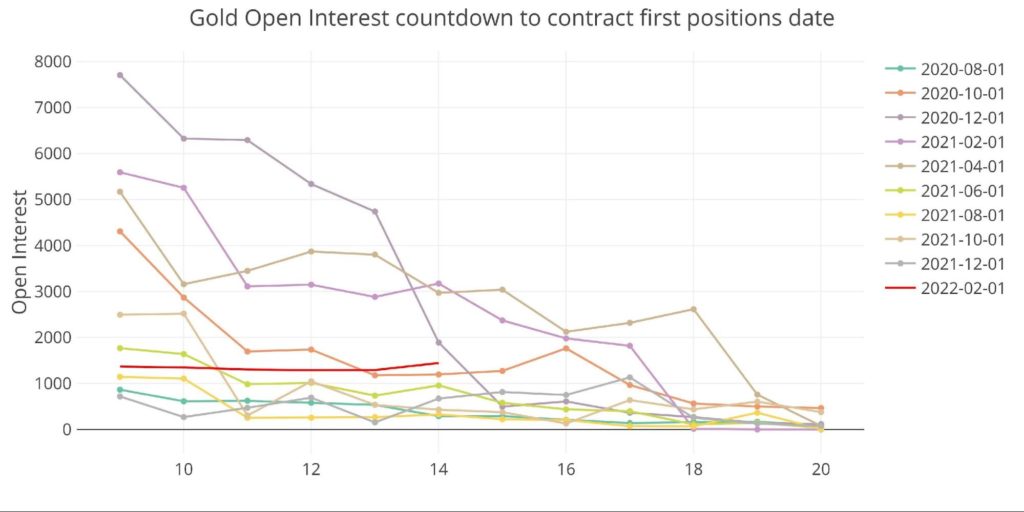
Figure: 11 Gold Open Interest
Another variable to look at is net new contracts after First Position. Once again, Feb 2022 is a standout. There have been 1,751 contracts that have cash settled instead of standing for delivery. Only Dec 2020 saw similar activity.
One might be thinking, “why is it considered strange for activity to occur in either direction?”. Think from an investor perspective… either an investor didn’t hold a contract but opened one for immediate delivery, or an investor intended to take delivery but cash settled instead. The first action might occur when an investor needs physical immediately and unexpectedly. The second is a bit harder to explain. What would drive a contract holder who wants physical to cash settle? Hard to know for sure, but strange regardless.
Normal activity would be similar to June 2021 below (light green) where only a few contracts (~700) open after First Notice for the entire month. In December 2021, 4,547 contracts opened for immediate delivery whereas in Feb 2022 1,751 contracts have cash-settled. It’s hard to understand what is driving such extreme and different behavior over the last two major months.
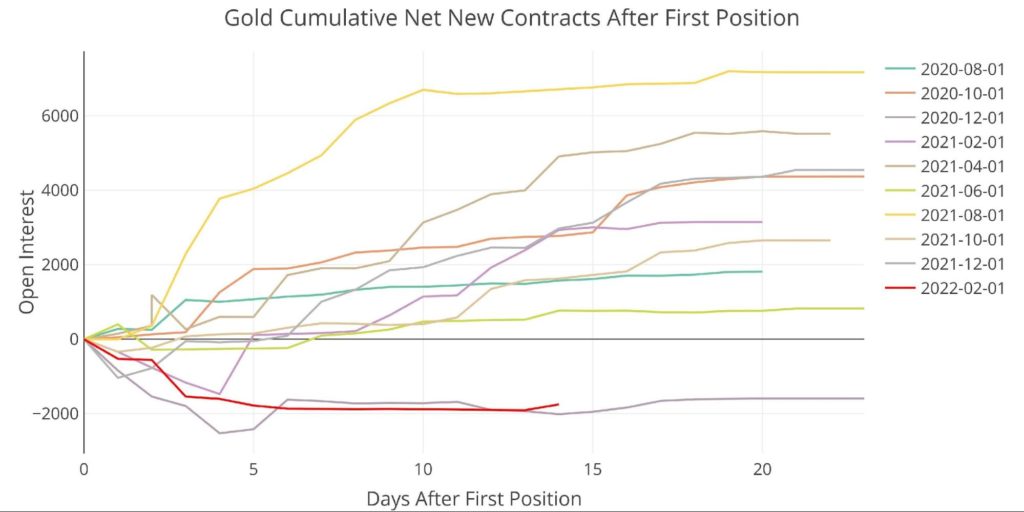
Figure: 12 Cumulative Net New Contracts
Looking at house account activity shows another pretty extreme month in Feb 2021. Bank of America has taken delivery of 5,488 contracts which is the highest on record for them. On the other side, the rest of the house accounts combined have delivered out 8,748 contracts. Ignoring BofA, this is also the largest on record.
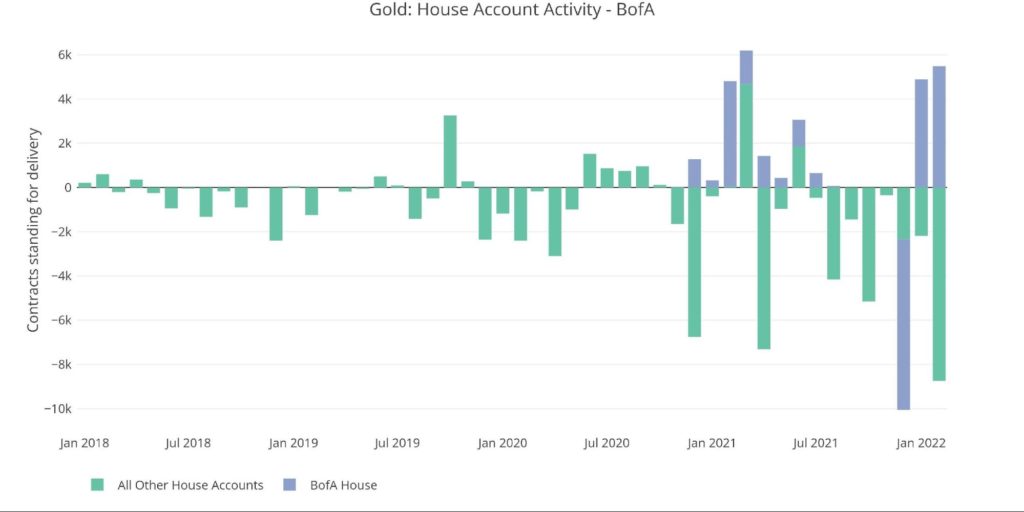
Figure: 13 House Account Activity
Gold: Next Delivery Month
Finally, looking forward in gold shows even more outlier trends. First a look at the countdown into close. March gold is holding well above past months. It has even started drifting back up in recent days. Considering March is a minor month, the intention of these contract holders is almost certainly to take delivery.
Why are these investors waiting a month though? While February is seeing cash settlement and a large number of open interest still outstanding (and not changing), March is seeing growing interest.
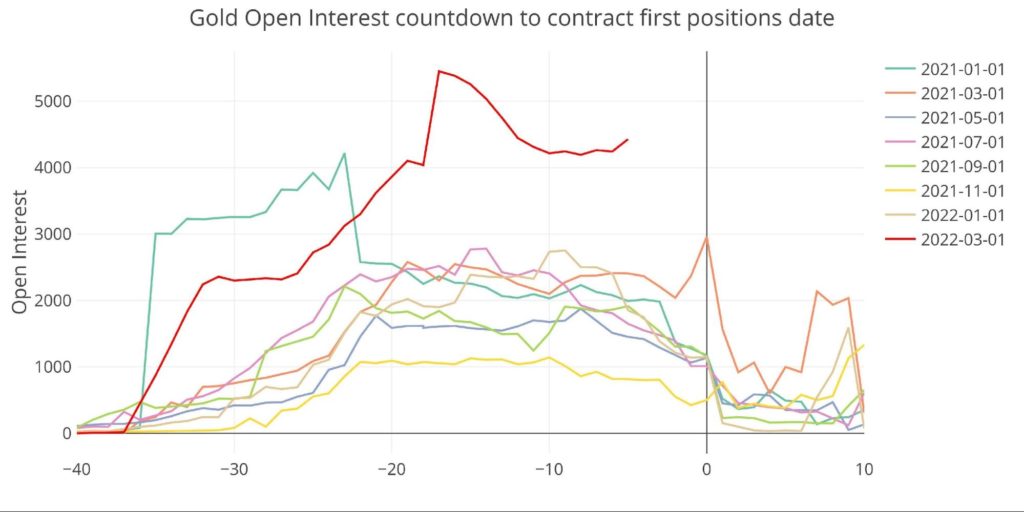
Figure: 14 Open Interest Countdown
Can March exceed the large delivery volume seen in January? Based on current open interest, deliveries would be lower, but that would not include mid-month contracts opening. Much is likely to change over the next couple of weeks as March draws closer to an end and then deliveries begin.
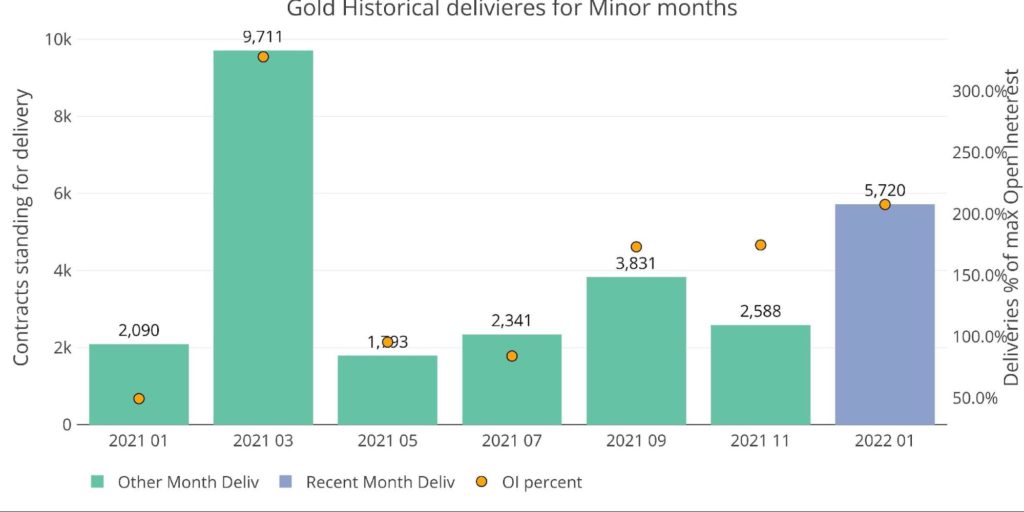
Figure: 15 Historical Deliveries
Looking out to April
Although March has not yet closed, looking ahead to April still reveals two other trends to watch.
First is the roll cost. This is the spread between the next two major contracts. April currently sits above average but has not yet moved in a big direction. Similar to net new contracts after First Notice, a big move in either direction could be considered an outlier event. That has not (yet?) happened in April.
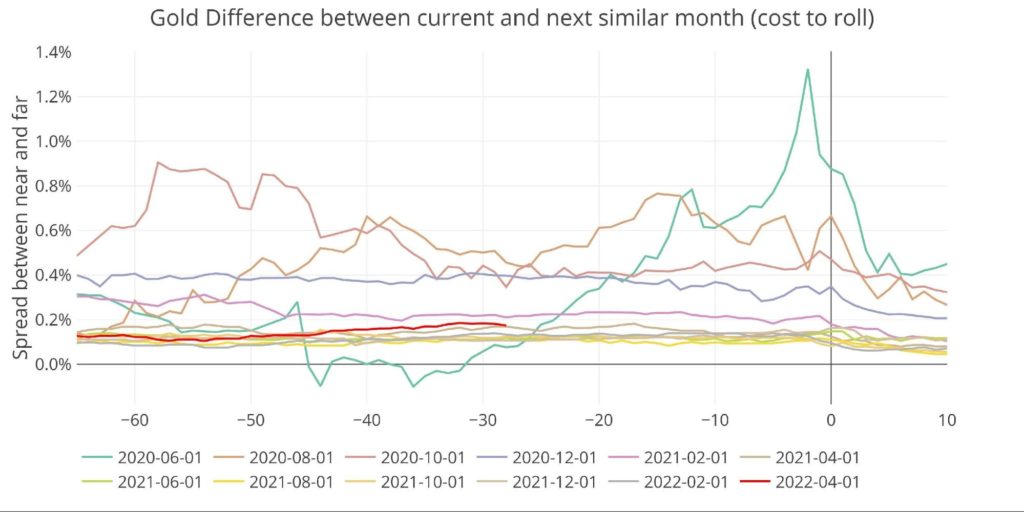
Figure: 16 Roll Cost
One thing that has occurred is a major pick-up in open interest. April is about to begin the process of rolling to June but activity has all of a sudden picked up in April (possibly a result of Ukraine). April open interest currently sits at 466k which is well above where it normally sits for a major month. The major spike-up is also something that should be watched.
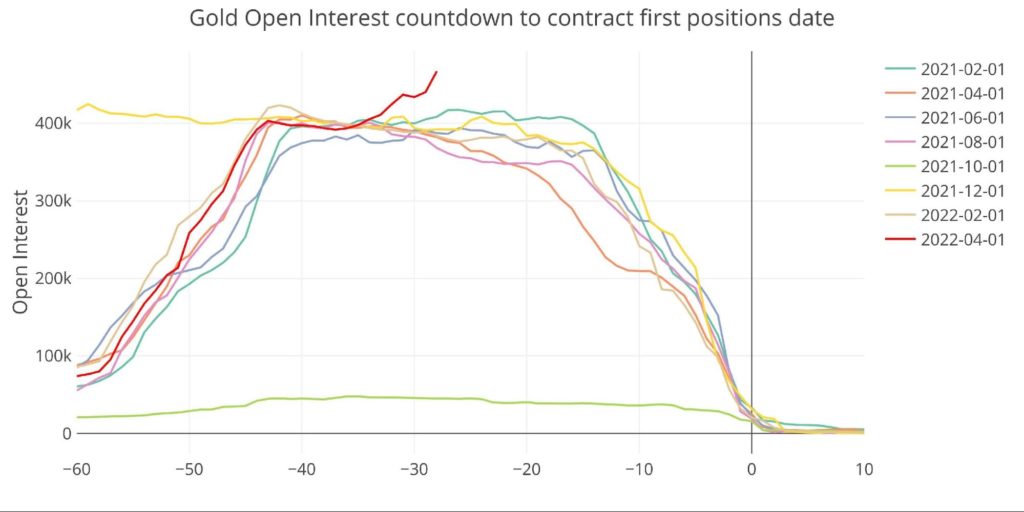
Figure: 17 Open Interest Countdown
Wrapping up
Recent weeks have seen several flashing yellow signs in the gold market. Silver is not yet flashing the same warning signs, but this is not unexpected. Gold is a bigger market with major global players. It will be the first market to start flashing.
A single outlier trend wouldn’t be cause for concern, but so many happening at once is something to keep a close eye on. It’s very possible these warning signs all fade and the market returns to normal. However, if a run on gold was to ever occur, it would start out looking exactly like this. Stay tuned!
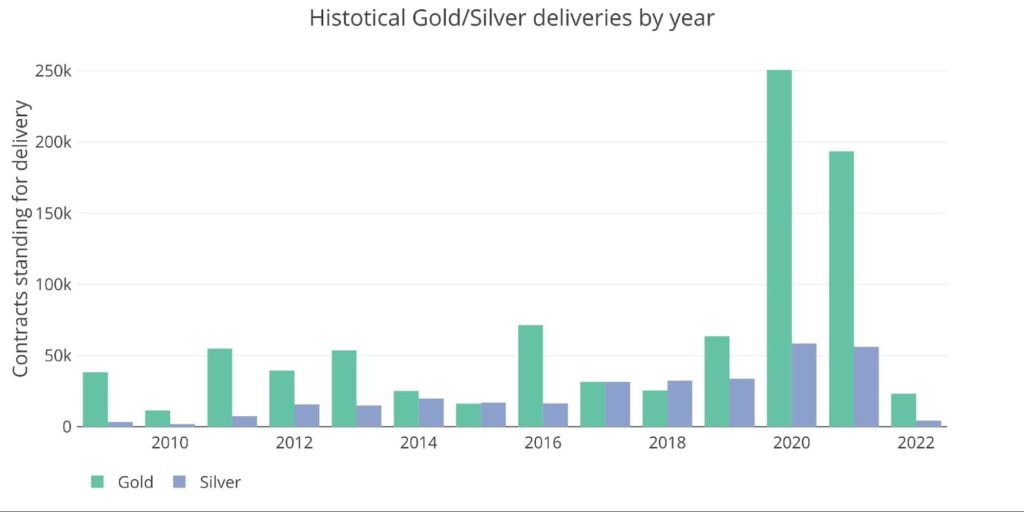
Figure: 18 Annual Deliveries
Data Source: https://www.cmegroup.com/
Data Updated: Nightly around 11 PM Eastern
Last Updated: Feb 17, 2022
Gold and Silver interactive charts and graphs can be found on the Exploring Finance dashboard: https://exploringfinance.shinyapps.io/goldsilver/

Call 1-888-GOLD-160 and speak with a Precious Metals Specialist today!
Buka akaun dagangan patuh syariah anda di Weltrade.
Source link