As reported last week, multiple data points are starting to flash yellow in the gold market. Cash settlements are at a recent high, open interest has spiked in March way above normal, and roll costs are creeping up.
Gold: Recent Delivery Month
At first glance in the chart below, nothing looks strange about February. It may have taken a few extra days for contracts to deliver, but 5 days in looks fairly normal. If anything, delivery looks slightly weak at 16,528 even if the current open interest of 2,365 will bring total delivery volume above October. Looking beneath the surface tells a different story, however.
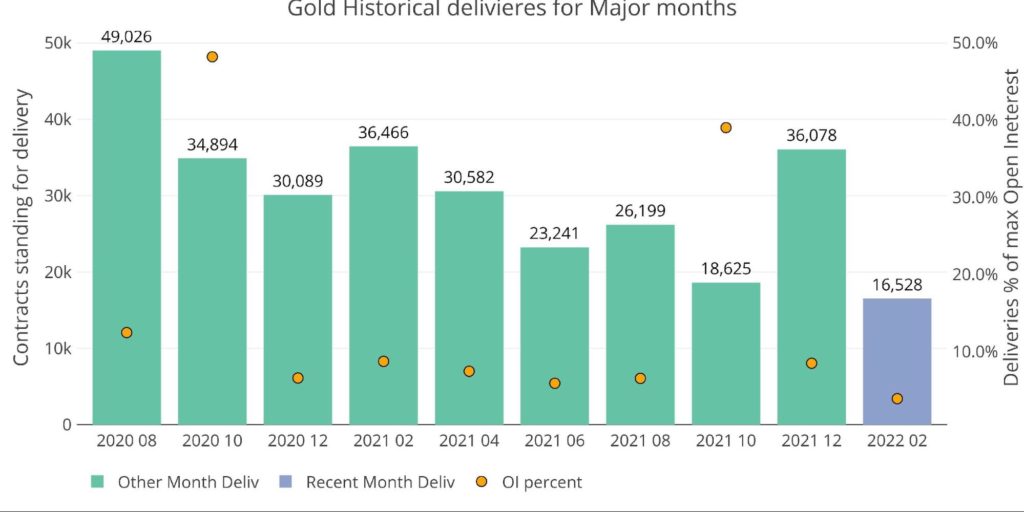
Figure: 1 Recent like-month delivery volume
Mid-month activity has been tracked very closely over the last year. Since Covid started, the trend has been to open positions mid-month for immediate delivery. As of now, the exact opposite has occurred in February with contracts cash settling.
In fact, 1,781 contacts have cash settled instead of standing for delivery. This is the highest cash settlement since Oct 2018 and a major deviation from the recent trend of nearly all positive net new contracts.
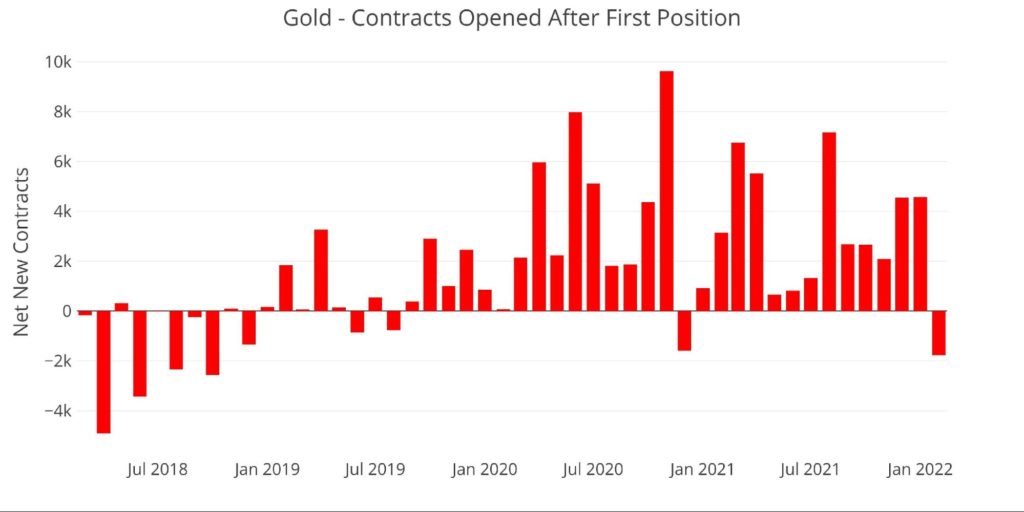
Figure: 2 Net New Contracts
It’s still early in the month, so the trend could change. As shown below, the countdown could start moving up, but that action has not started yet.
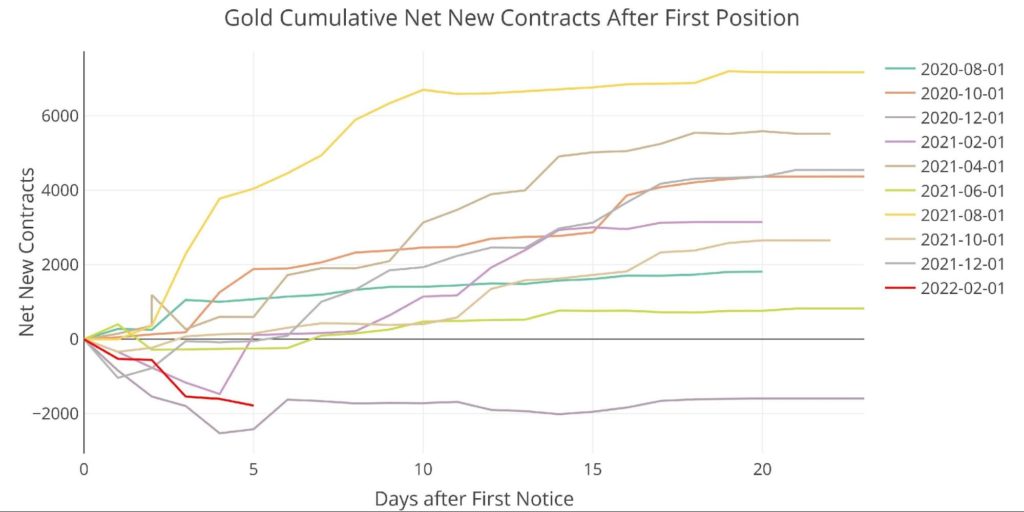
Figure: 3 Cumulative Net New Contracts
Another data point to focus on is the activity in house accounts. Bank of America (BofA) has been engaging in very strange activity over the last several months while the other house accounts have been bleeding out.
In the recent month, both these trends have accelerated. BofA has taken delivery of 5,062 contracts, the greatest amount on record. The rest of the house accounts have been on the other side, delivering out 8,999 contracts. Also the greatest monthly amount on current record. Are house accounts holding up the physical market with their own supply?
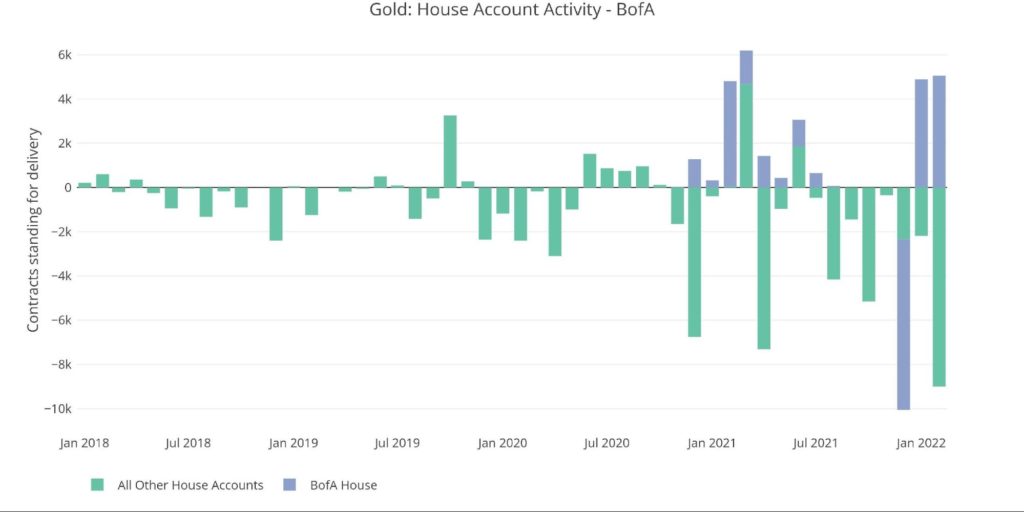
Figure: 4 House Account Activity
Jumping ahead to March shows another major trend divergence. This chart shows the open interest countdown for all minor months going back almost 2 years. Open interest shot up to 5,450 before dipping back down to 5,050. It still sits above May 2020, which was just before gold went on a run to new highs.
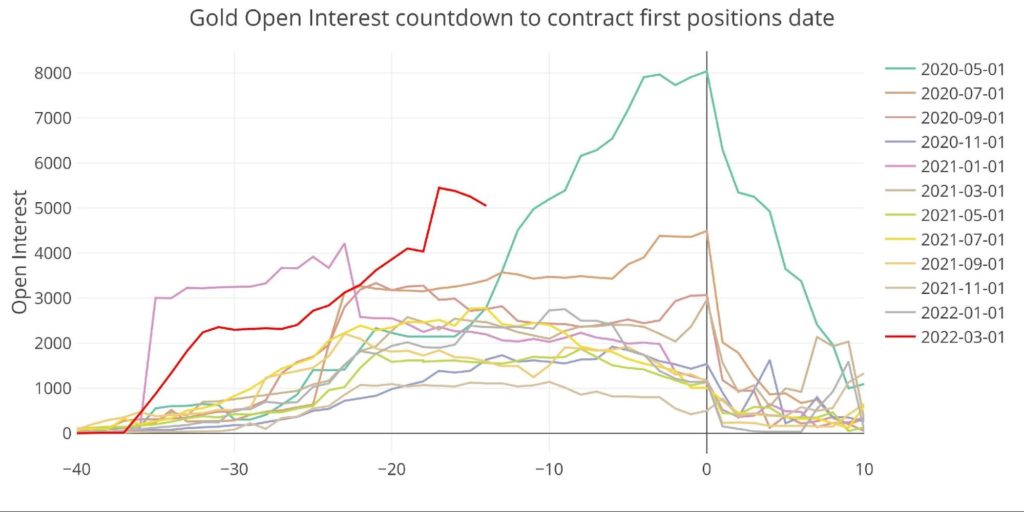
Figure: 5 Open Interest Countdown
Comparing this March to previous March’s shows an even more extreme divergence. March 2020 was the only other month even close, and that was in the depths of the Covid uncertainty.
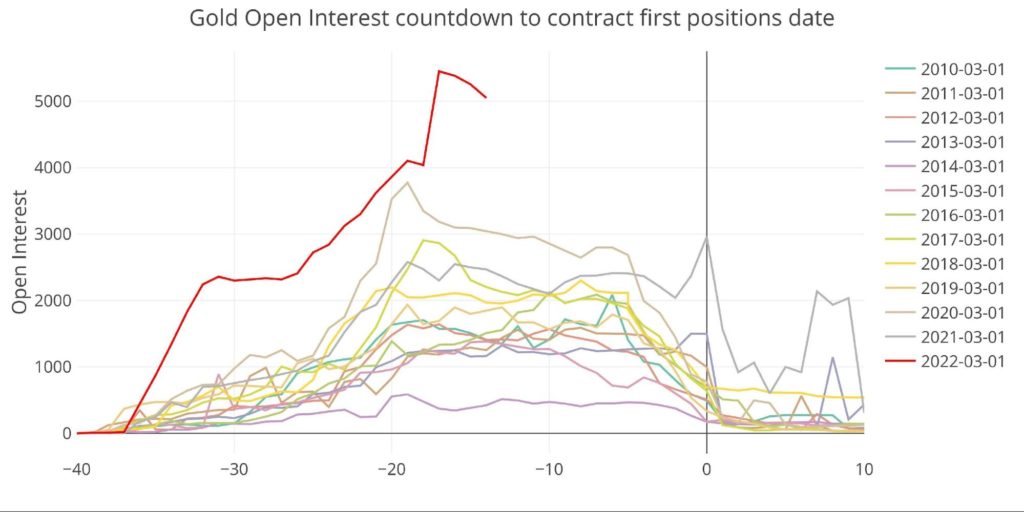
Figure: 6 Open Interest Countdown
The last variable to look at is the spread between April and June. This is also referred to as “Roll Costs”. This is not yet flashing a major warning sign, but it is still creeping upwards.
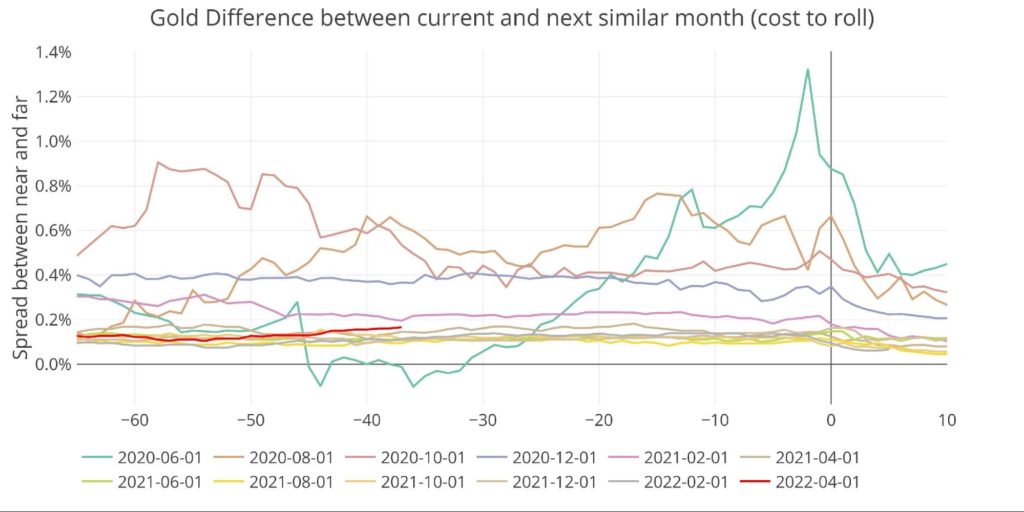
Figure: 7 Roll Cost
Overall, the market is showing warning signs. This might not be the warning of an impending market run on gold, but the early signs would look a lot like this:
- Cash settlement in current month
- Rising open interest in the next month
- Widening spreads
If the market was flashing red, all these signs would be even more extreme. However, this many indicators flashing yellow should not be ignored.
Data Source: https://www.cmegroup.com/
Data Updated: Nightly around 11 PM Eastern
Last Updated: Feb 04, 2022
Gold and Silver interactive charts and graphs can be found on the Exploring Finance dashboard: https://exploringfinance.shinyapps.io/goldsilver/

Call 1-888-GOLD-160 and speak with a Precious Metals Specialist today!
Buka akaun dagangan patuh syariah anda di Weltrade.
Source link