Euro, British Pound, EUR/USD, GBP/USD, GBP/JPY Talking Points:
- It’s been a busy 24 hours around markets and this morning brought rate decision from both the European Central Bank and the Bank of England.
- Yesterday’s FOMC rate decision appears well received by equity markets at this point, helping to drive the risk-on theme across markets as the Fed threaded the needle of delivering a hawkish message with a dovish bias.
- The analysis contained in article relies on price action and chart formations. To learn more about price action or chart patterns, check out our DailyFX Education section.
We’ve now been through three major central bank rate decisions in the past 24 hours and the price action in FX has continued to run.
Yesterday’s FOMC rate decision saw the Fed make a hawkish push that seems to be taken very well by market participants. Of course, there was a bit of two-sided talk coming out of that meeting. While Powell and the Fed did indicate the possibility of 5-6 hikes over the next two years, he also said that lift-off wouldn’t take place until the U.S. was at ‘full employment.’
What might full employment be? That’s an interesting question, as last month’s NFP report saw the unemployment rate sink to 4.2% which, normally, would fit that bill. But from yesterday’s press conference it appears that the Fed wants to see that unemployment rank sink even more while waiting on more inflation to show via wage gains.
That helped to pull back the US Dollar while acting as a lightning rod for stocks, sending the S&P 500 to another fresh all-time-high that was hit this morning.
Prices have since started to pull back but, there’s a major level of resistance sitting around the newly-established ATH that may take another bullish run or two before finally giving way. At this point, support potential in the S&P 500 exists around prior resistance points of 4700, 4671 and 4644.
It also appears as though an inverse head and shoulders pattern has built here, with a neckline around resistance – further pointing to the possibility of more fresh ATHs ahead of year-end.
S&P 500 Four-Hour Price Chart
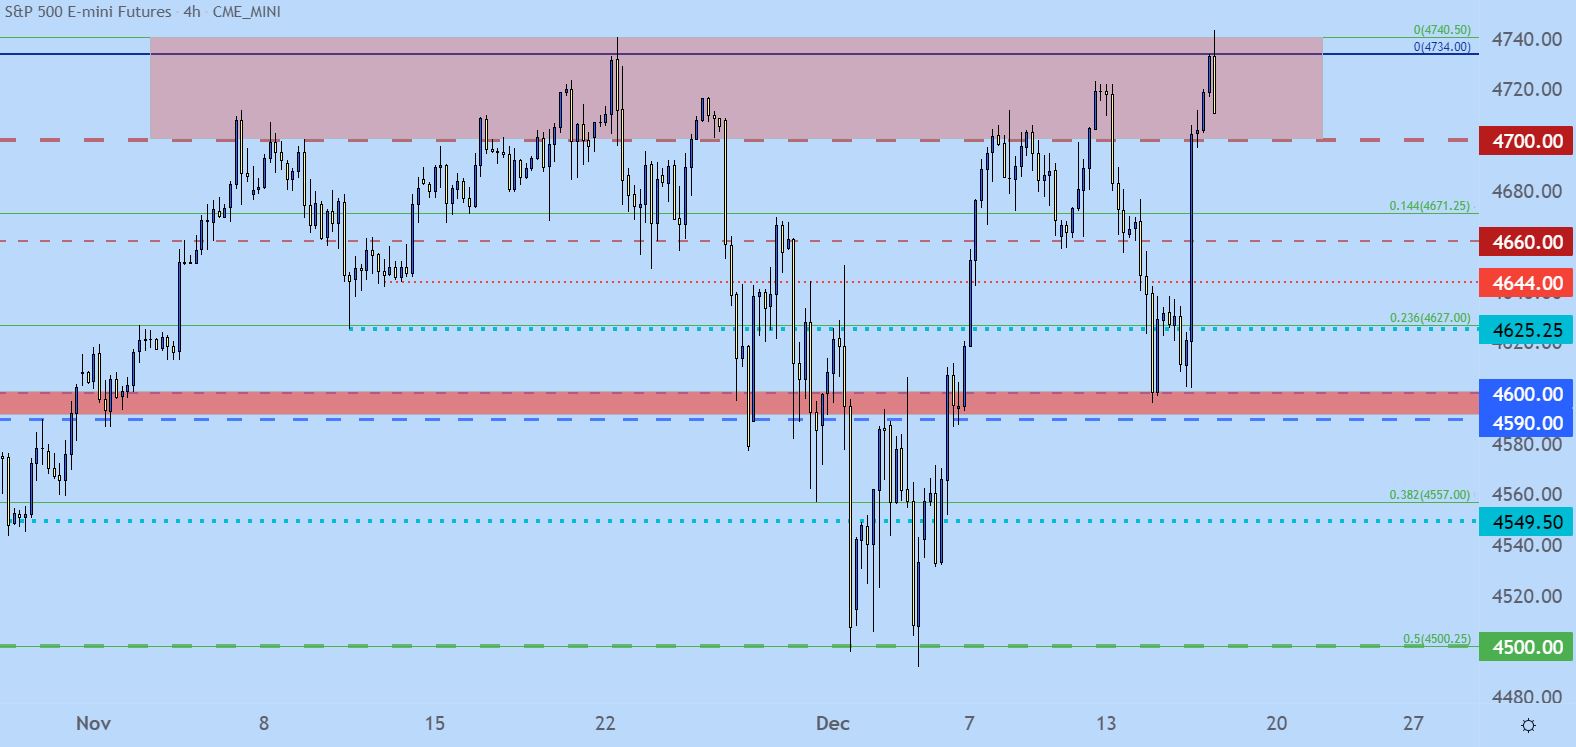
Chart prepared by James Stanley; S&P 500 on Tradingview
The British Pound and the BoE
In somewhat of a surprise the Bank of England lifted rates this morning by 15 basis points to arrive at a rate of .25%. While this hike may seem minor, it’s the same move that the bank did not make in early-November that helped to punish the Pound.
But, as looked at over the past week, GBP/USD was at a major support level, threatening to invalidate a bull flag formation that had spent much of the year building. That spot of support was also around the 38.2% retracement of the 2020-2021 major move, adding a bit of confluence to the mix.
This zone held through last week’s close and this week’s open, up until this morning’s rate decision brought a bullish flare into the mix.
At this point, the weekly chart is showing a non-completed morning star formation, and if the weekly bar closes with this formation confirmed the door will begin to open to longer-term bullish strategies in the pair.
GBP/USD Weekly Price Chart
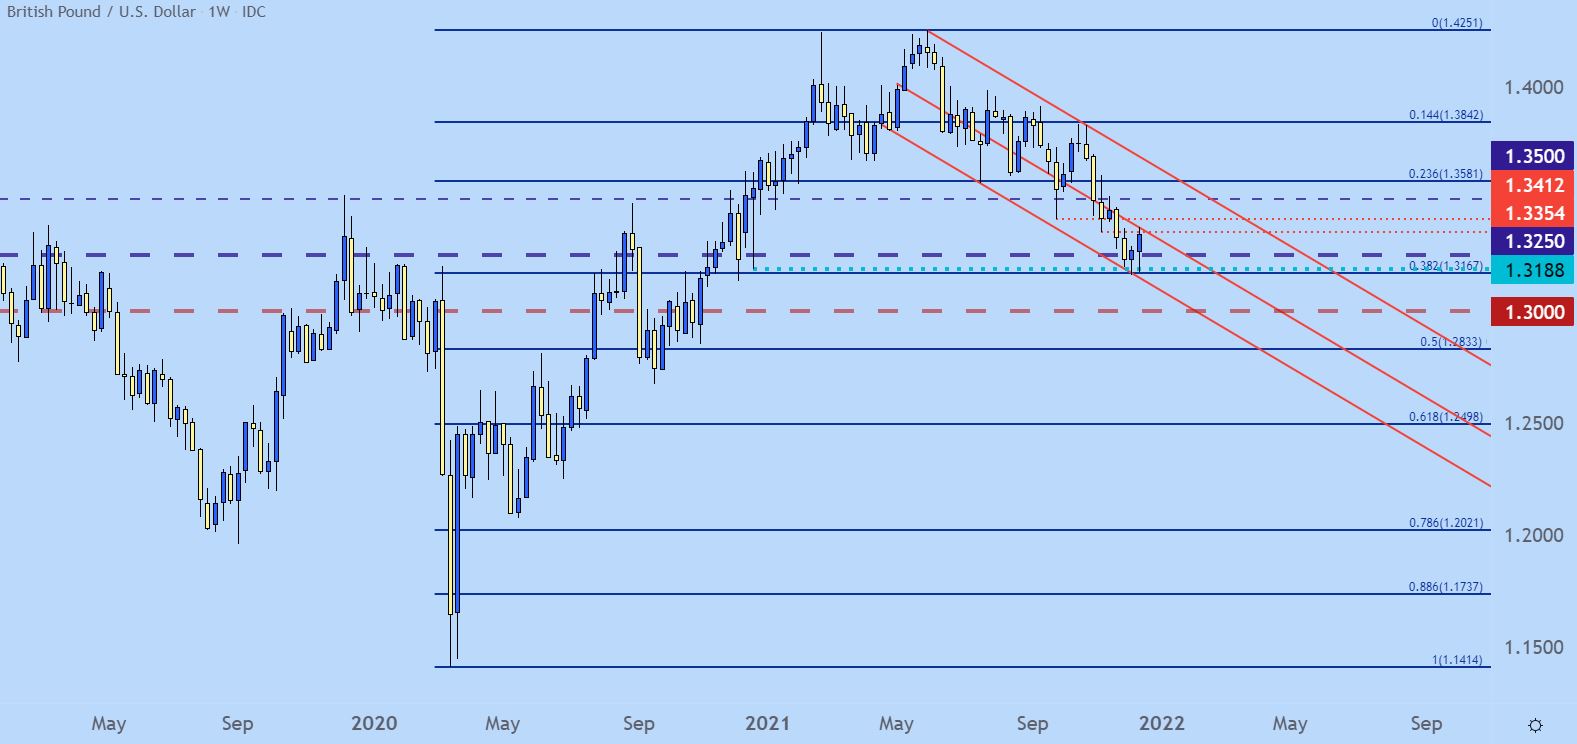
Chart prepared by James Stanley; GBPUSD on Tradingview
GBP/JPY Jumps
GBP/JPY had pushed down to a support zone that had held the lows admirably throughout 2021 trade so far. And as I mentioned a couple of times over the past week, from a fundamental perspective, GBP/JPY was more attractive to me on the long side, especially given the carry potential from the Japanese Yen should rate markets begin to look for more rate hikes in 2022 trade.
As the pair was grinding at that support, a symmetrical triangle built, and that formation began to give way yesterday around the FOMC rate decision.
GBP/JPY jumped up for a test of the psychological level at 152.50, at which point prices started to pull back. The next level of support interest is taken from prior resistance, around the 151.13 level. A hold of support there keeps the door open for bullish continuation scenarios.
GBP/JPY Four-Hour Price Chart
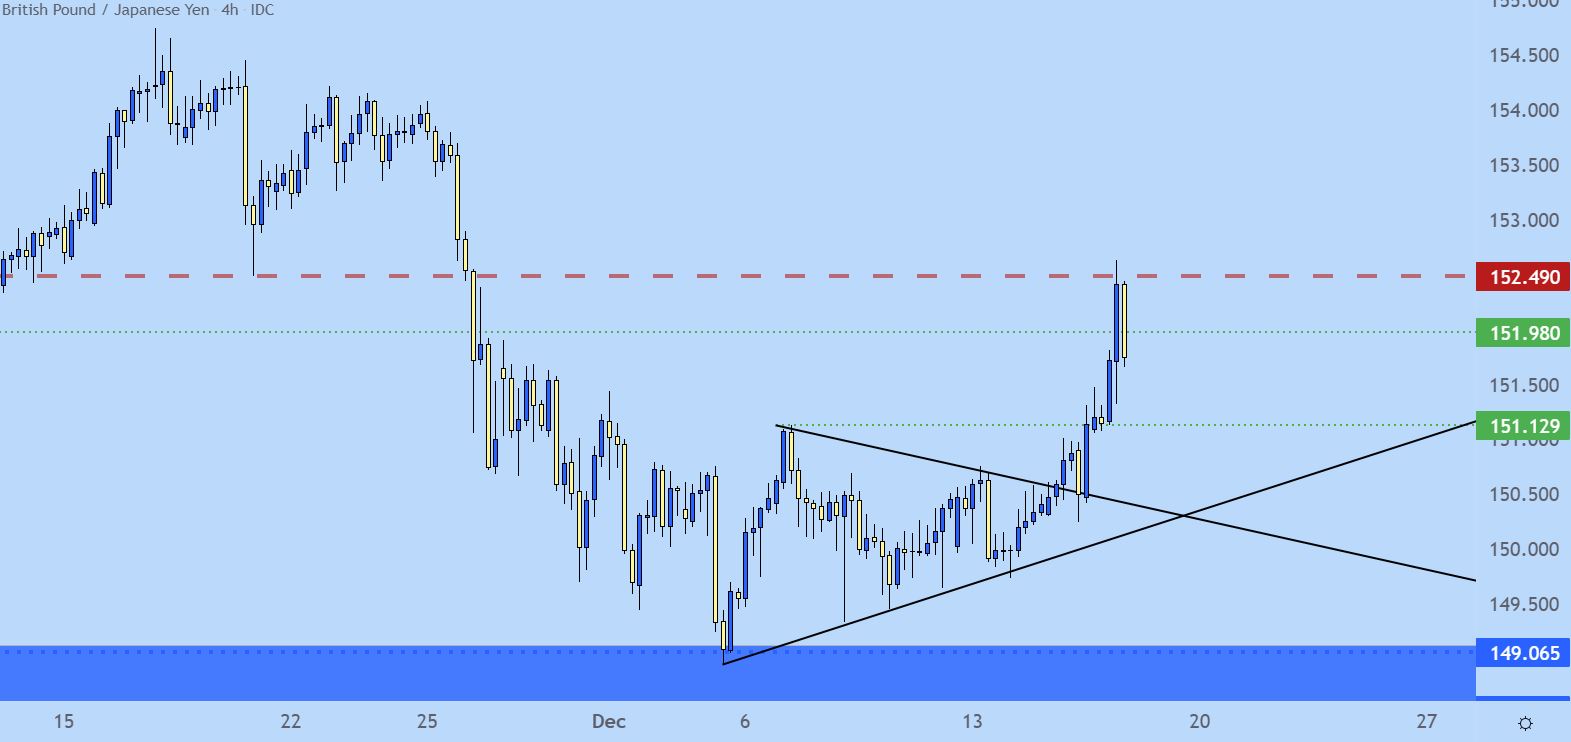
Chart prepared by James Stanley; GBPJPY on Tradingview
Euro and the ECB
The ECB was dovish as usual this morning, but I doubt there was much surprise there. It seemed as though markets were cautiously expecting the bank to go even more dovish than they did, and the relief has allowed for EUR/USD to lift up towards near-term resistance.
Similar to GBP/JPY from yesterday, a symmetrical triangle formation has built near a significant support zone. The support zone I’ve discussed numerous times since it came back into play in late-November, and runs from 1.1187-1.1212. This is a significant area on the chart that’s been in-play in multiple ways going back to 2015 trade, so bears may need a greater driver to finally leave it behind, but at this point there does remain downside potential, as today’s bar has whittled back below the symmetrical triangle formation.
The key here is the daily close. If price action on the daily closes inside of this wedge, the bearish side of the argument remains as more attractive. If it doesn’t, a continued pullback will look more likely and that can bring into play resistance at 1.1374 or 1.1448-1.1500.
But, the fundamental divergence that’s driven the pair well in the second-half of 2021 remains in-play, and this can lead to fresh lows at some point.
EUR/USD Daily Price Chart

Chart prepared by James Stanley; EURUSD on Tradingview
— Written by James Stanley, Senior Strategist for DailyFX.com
Contact and follow James on Twitter: @JStanleyFX
Buka akaun dagangan patuh syariah anda di Weltrade.
Source link