

Gold inventories in Comex vaults increased for only the second time since February this year.
This analysis focuses on gold and silver within the Comex/CME futures exchange. See the article What is the Comex? for more detail. The charts and tables below specifically analyze the physical stock/inventory data at the Comex to show the physical movement of metal into and out of Comex vaults.
Registered = Warrant assigned and can be used for Comex delivery, Eligible = No warrant attached
Current Trends
Gold stocks increased by about 280k ounces in December and 517k since the last stock report. Could this be due to a surge in delivery requests? As reported last week, December delivery notices reached the highest point since March of this year in both gold and silver.
When contracts stand for delivery, a Short with Registered metal transfers the warrant to the Long. The metal does not physically leave the vault nor does it move metal from Eligible to Registered. That being said, the Short no longer has the metal and would need to restock to deliver a future contract. Additionally, the Long now has the option to remove the metal from the Comex vault.
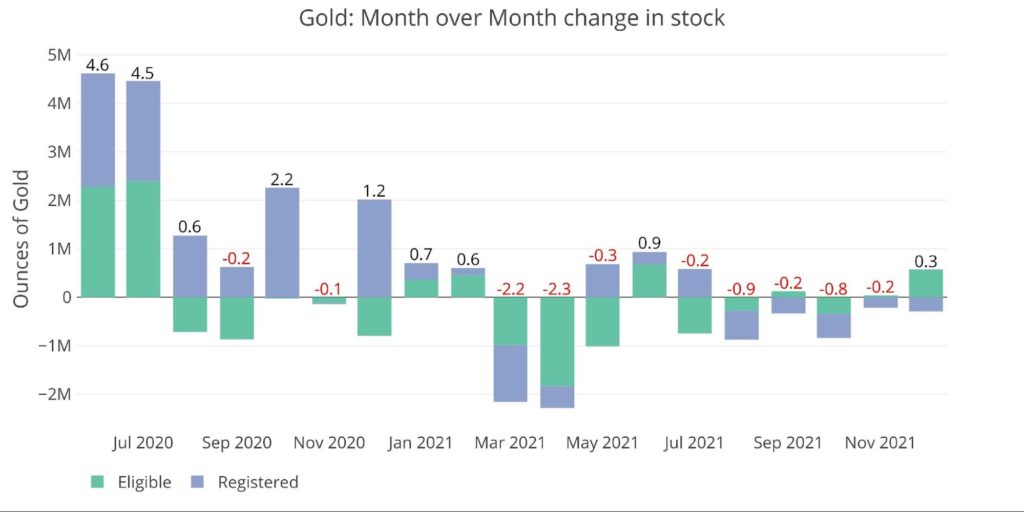
Figure: 1 Recent Monthly Stock Change
The chart below shows the daily activity since the last report. The activity picked up after the December contract stood for delivery. The net increase has been just shy of 300k, but this pales in comparison to the delivery activity. About 3.4M ounces of gold stood for delivery in December, 1.4M of which was JP Morgan clients.
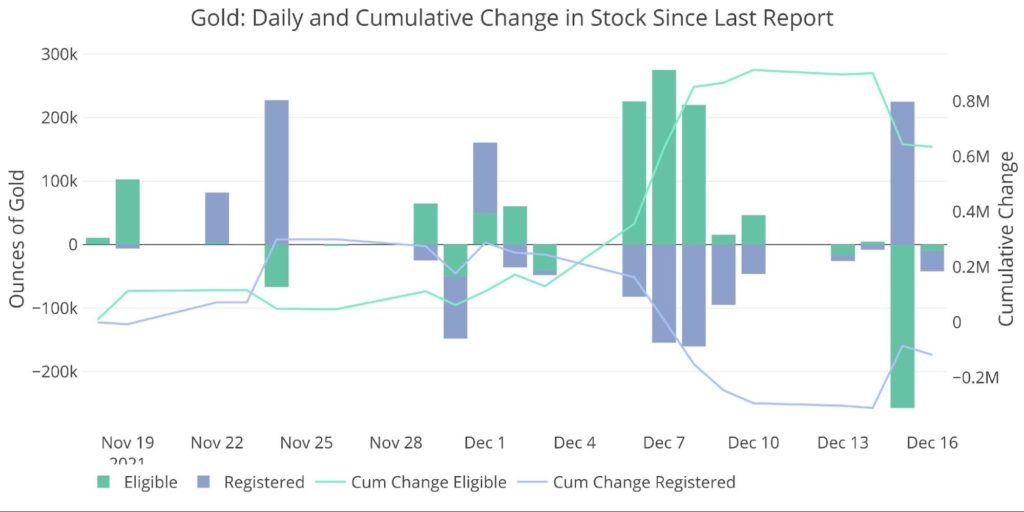
Figure: 2 Recent Monthly Stock Change
Silver has seen stocks increase by about 2M ounces in December so far. Again, this is a fraction of the 45M ounces that have stood for delivery so far in December.
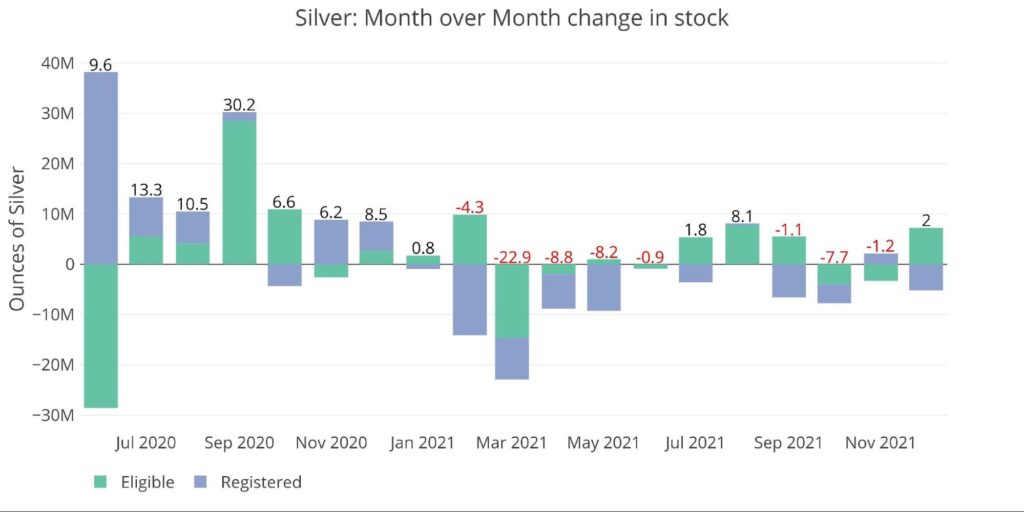
Figure: 3 Recent Monthly Stock Change
Looking at the detailed report shows a big one-day move from Registered back to Eligible (the warrant was removed). Manfra was the vault that made this adjustment on Dec 6 of nearly 6M ounces of silver. Unfortunately, there is not much more detail beyond the excel and PDF reports available on the Comex website. Any guesses to explain the activity would be pure conjecture. Perhaps someone stood for delivery and then moved their inventory back to Eligible to keep it out of the delivery cycle going forward.
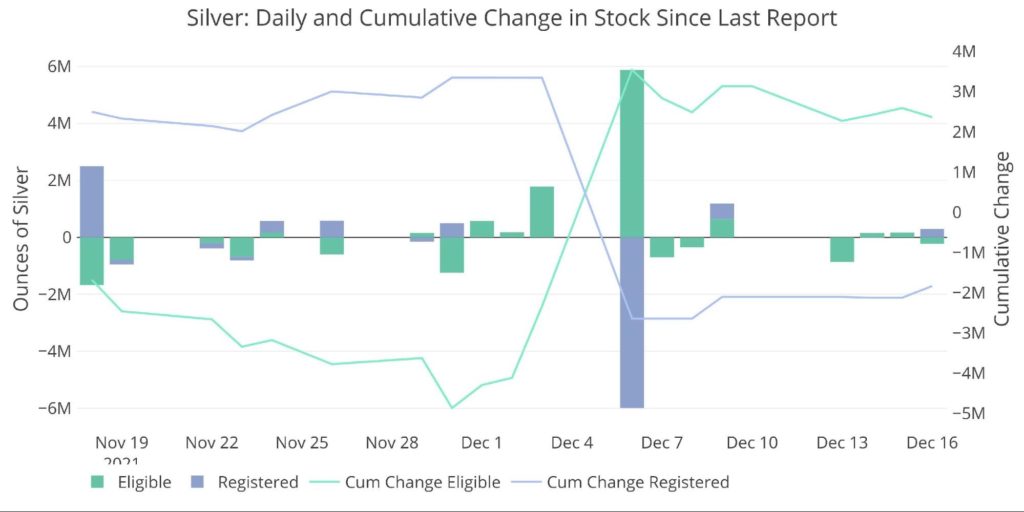
Figure: 4 Recent Monthly Stock Change
The table below summarizes the movement activity over several time periods.
Gold
- 2021 has seen a major fall in supply after the vaults rushed to increase their positions in the wake of the liquidity crunch from Covid. Gold has seen stocks deplete by 4.5M ounces which represent about 11.3% of the original balance.
- Eligible has seen the majority of that move with 15% of the stock being depleted.
- Although the last 30 days saw an increase in inventory, it is already headed back out the door as the 1 Week change shows
Silver
- Silver has also seen a 10.7% stock depletion. Unlike gold, this has been entirely concentrated in Registered which has lost 37.5%.
- The drop in Registered is a signal of Warrant holders taking physical delivery of their metal.
In a normal year, and without the major restocking in 2020, the activity this year would be unprecedented (see historical charts below).
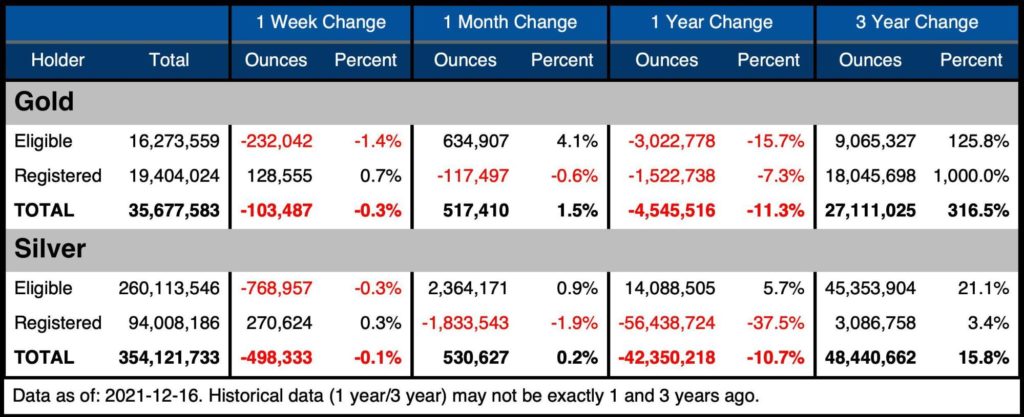
Figure: 5 Stock Change Summary
The next table shows the activity by bank/Holder. It details the numbers above to see the movement specific to vaults.
Gold
- Over the last month, JP Morgan, HSBC, and Manfra have all increased their inventory by about 2.5%-3.5%
- For the year, JP Morgan was the only vault who saw stock deplete less than 9%, with several seeing losses of 28% or more
Silver
- Similar to gold, JP Morgan has increased its inventory by 3.3M ounces or about 1.8%. Delaware and Brinks also saw increases.
- CNT Depository actually lost more than JP Morgan gained, which represented 10% of their entire inventory.
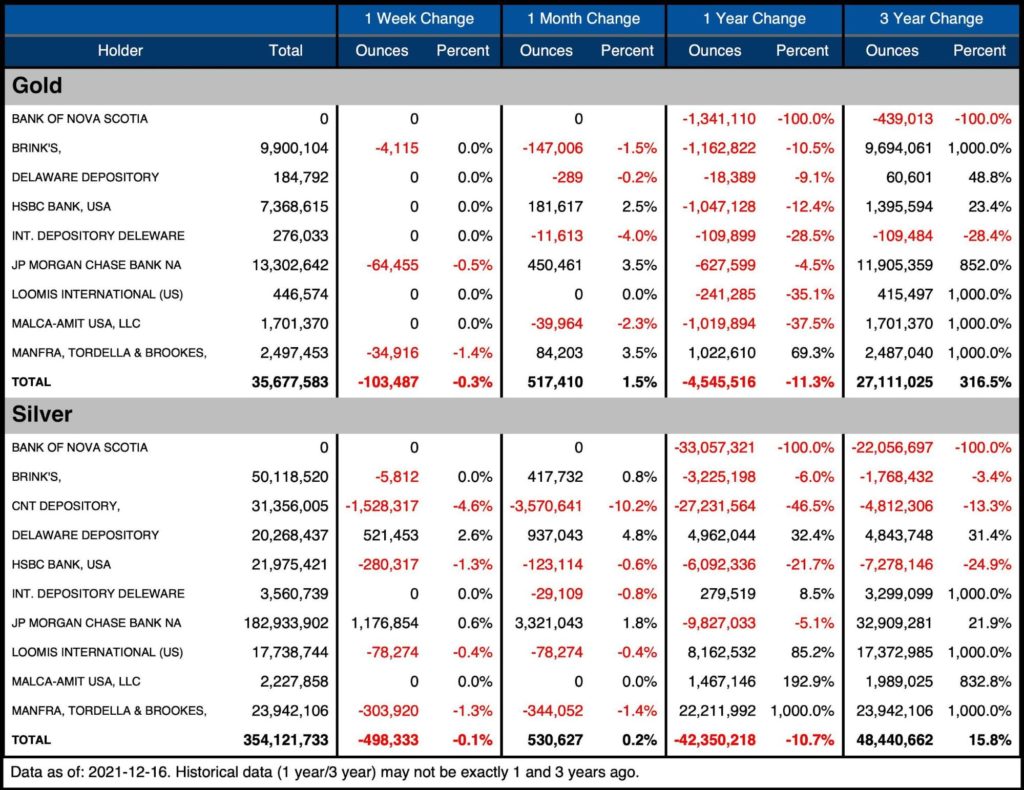
Figure: 6 Stock Change Detail
Historical Perspective
Zooming out and looking at the inventory for gold and silver since 2016 shows the impact that Covid had on the Comex vaults. Gold had almost nothing in the Registered category before JP Morgan and Brinks added their London inventory with nearly 20M ounces.
In fact, delivery in Dec 2019 was exactly 1.47M ounces. At the same time, on Dec 10, 2019, the total Registered stood at exactly 1.47M. This was up from 1.1M ounces on Nov 24, 2019. That means the entire pool of Registered turned over in a single month. In order to meet the demand, metal had to be moved from Eligible. Since then, the vaults have given themselves much more wiggle room as shown below in orange.
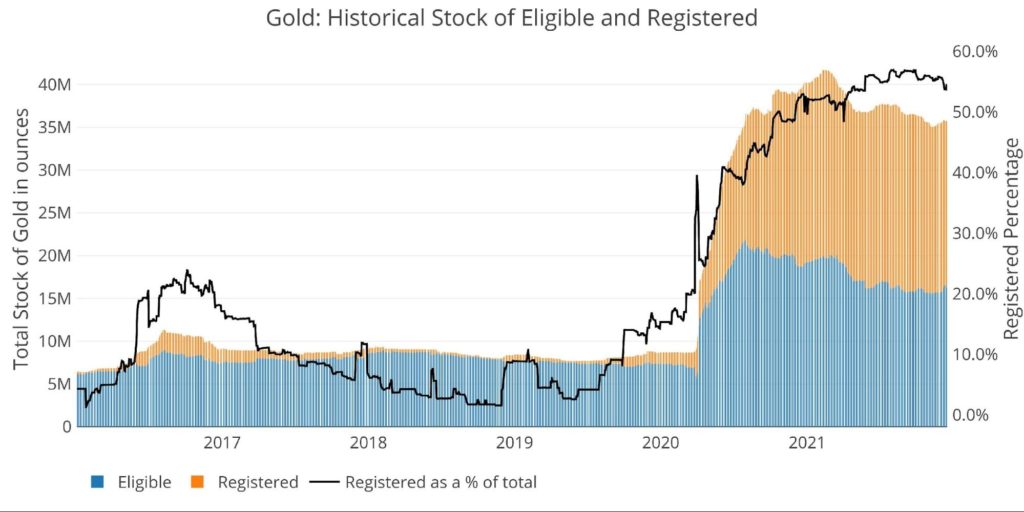
Figure: 7 Historical Eligible and Registered
Silver also saw an increase in Registered around March 2020, but this has been draining much more steadily back to pre-Covid levels. Interestingly the ratio of Registered to Eligible is the lowest it has been since Covid started and even sits below 2019 levels at 26.3%.
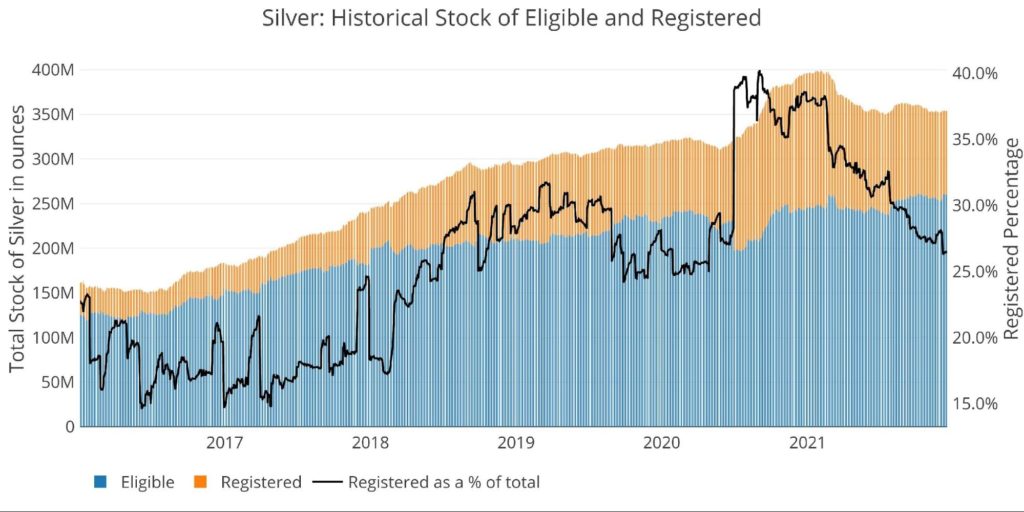
Figure: 8 Historical Eligible and Registered
Available supply for potential demand
Many critics point to the massive open interest compared to available inventory at the Comex. As can be seen in the chart below, the ratio of open interest to total stock has fallen from over 8 to 1.4. In terms of Registered (available for delivery against Open Interest), the ratio collapsed from nose bleed levels down to 2.6.
This ratio saw a recent uptick as open interest in gold increased dramatically in November when gold broke through $1800. Unfortunately, the price spike didn’t last and the ratio came back down. Gold is trying to regain some momentum after the Fed meeting this week though.
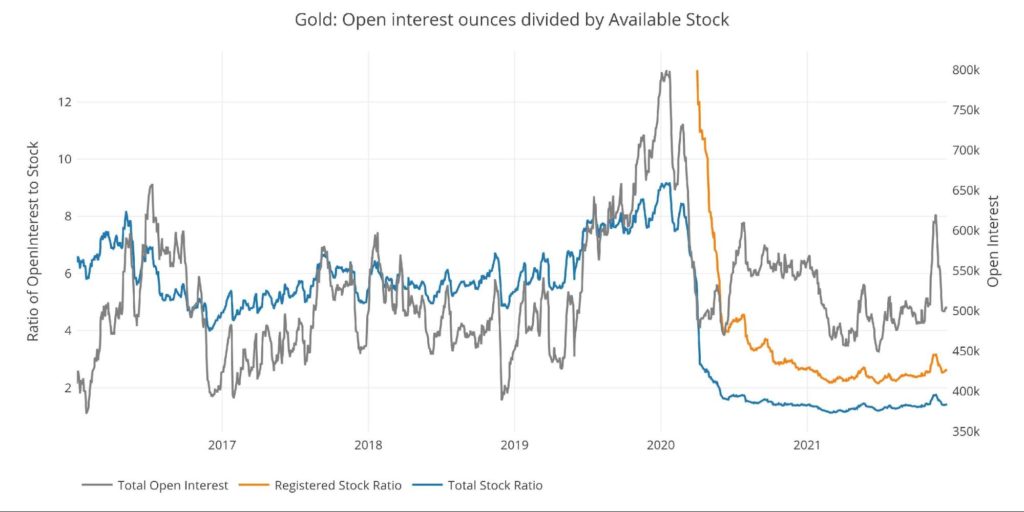
Figure: 9 Open Interest/Stock Ratio
Coverage in silver is weaker than in gold with 7.4 open interest contracts to each available physical supply of Registered. This was as low as 6.5 in July, after reaching 9.1 in June. This ratio was up to 14 in 2019 before the Covid crash in silver open interest. Silver open interest has not recovered, but this is probably due to higher silver prices (traders may want the same dollar exposure).
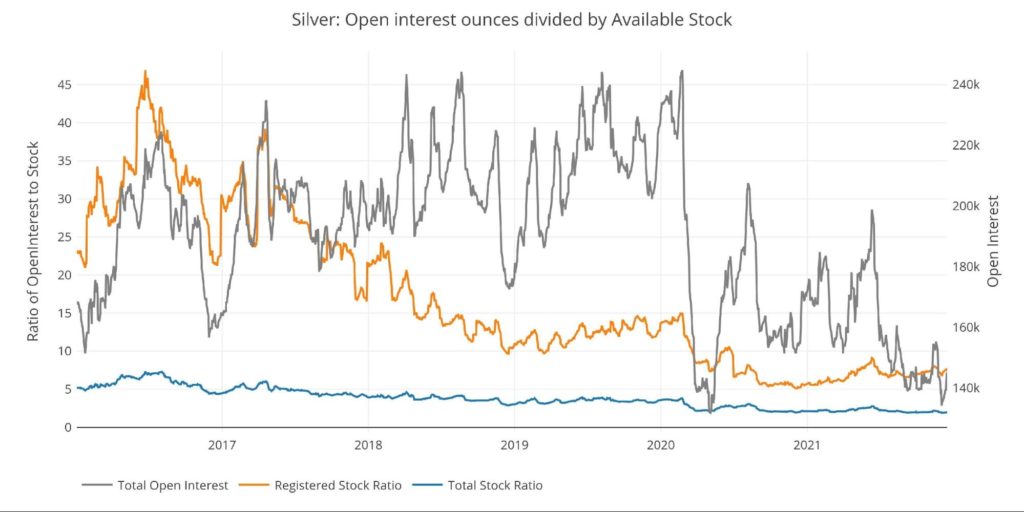
Figure: 10 Open Interest/Stock Ratio
What it Means for Gold and Silver
While the monthly delivery of contracts certainly represents physical demand. Tracking the activity in the Comex vaults shows the actual movement of metal. Open interest can increase much faster than physical metal can show up in Comex vaults. If a true “precious metal run” occurred, the Comex would be hard-pressed to meet all physical demand.
Data Source: https://www.cmegroup.com/
Data Updated: Daily around 3 PM Eastern
Last Updated: Dec 16, 2021
Gold and Silver interactive charts and graphs can always be found on the Exploring Finance dashboard: https://exploringfinance.shinyapps.io/goldsilver/

Call 1-888-GOLD-160 and speak with a Precious Metals Specialist today!
Buka akaun dagangan patuh syariah anda di Weltrade.
Source link