
This analysis focuses on gold and silver physical delivery on the Comex. See the article What is the Comex for more detail.
Silver: Recent Delivery Month
Silver is wrapping up December which saw the highest delivery volume since the Reddit Silver Squeeze in March. At 8,847, this month will probably come in slightly below last December, even with 330 contracts outstanding. Regardless, December reversed a downward trend that has been in place since last July except for March (see declining bars below).
It will take a few months into 2022 to determine if this is truly a change in trend or simply an anomaly.
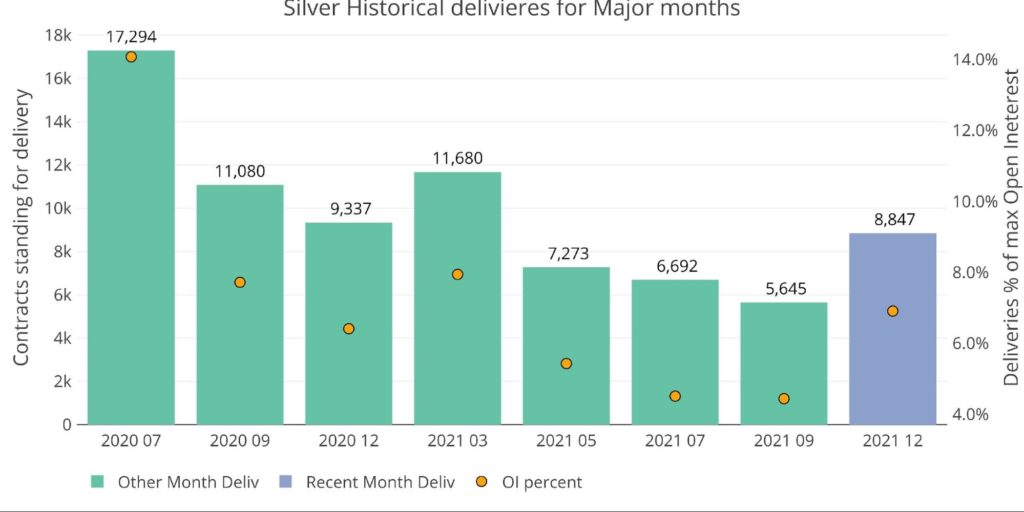
Figure: 1 Recent like-month delivery volume
The chart below shows another interesting data point. As the contract nears First Notice, open interest starts to dive. The final day typically shows the biggest drop in open interest. This can be seen below as the difference between the blue and green bars.
As shown, in the latest month, the dive on the final day was relatively small compared to what was seen in July and September. Even last December saw quite a substantial fall from 16k to 9.4k. This year the drop was from 13.5k to 9.4k.
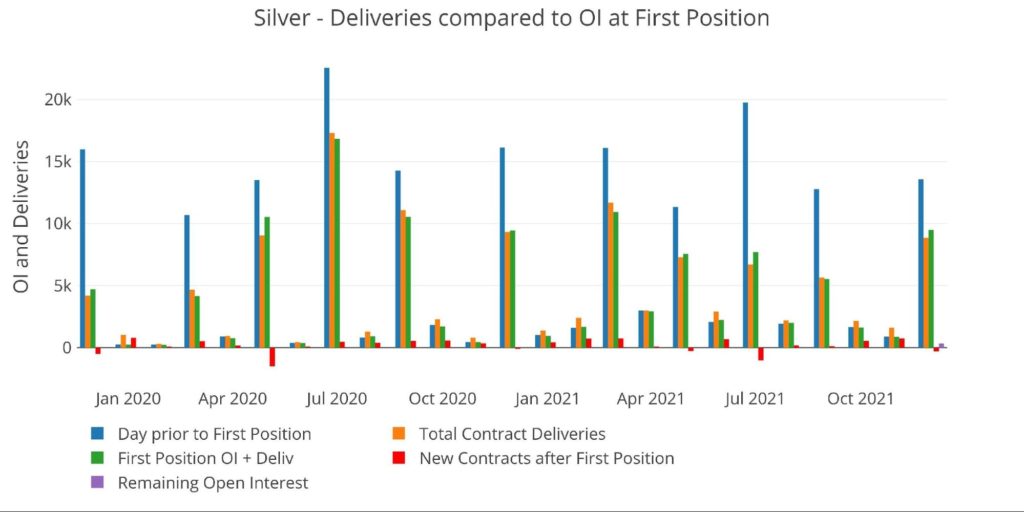
Figure: 2 24-month delivery and first notice
The green bars above represent the open interest on First Position which is typically a good predictor of the delivery volume for the month. This is when contracts need to post 100% cash. After First Position, contracts can still cash-settle, or contracts can open and stand for immediate delivery (red bars above). This December actually had slightly higher contracts on First Position than last December, but rather than seeing contracts opened for delivery, this month has seen more contracts cash settle.
In the minor months, there has been significant volume of contracts opening after First Notice. The major months follow a different trend. The chart below shows the major silver months cumulative new contracts after First Position. July suspiciously saw a massive number of contracts cash settle, and this December is now showing the second-biggest cash-settled contracts. The trend has turned in recent days though and it’s starting to move up. With about 5 days to go, it could still turn positive, but only July 2020 saw such an extreme reversal. Currently, 307 contracts have cash-settled.
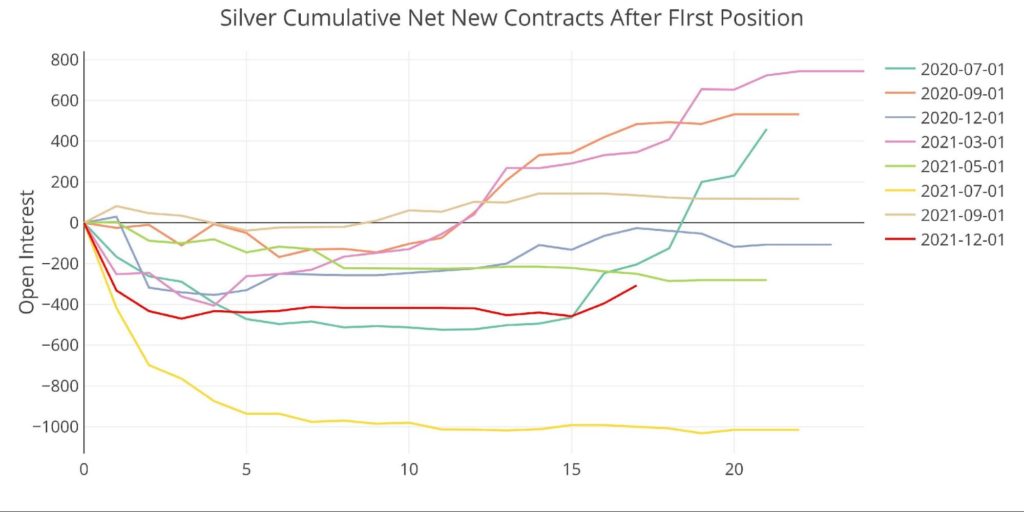
Figure: 3 Net New Contracts
From a historical perspective, this December was the second-largest December on record. Below shows the notional (dollar) value of contracts delivered. With 363 contracts still open, this month will most likely exceed $1B of silver delivered!
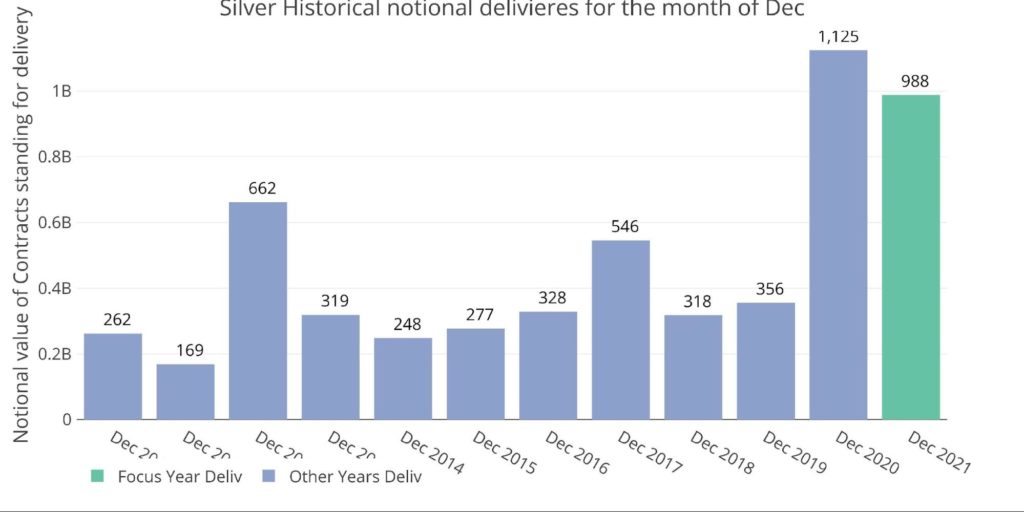
Figure: 4 Notional Deliveries
Silver: Next Delivery Month
January still has 5 business days to go until First Notice, but at 2,285 open interest, it could be the strongest minor month since April of this year, again right after the Silver Squeeze.
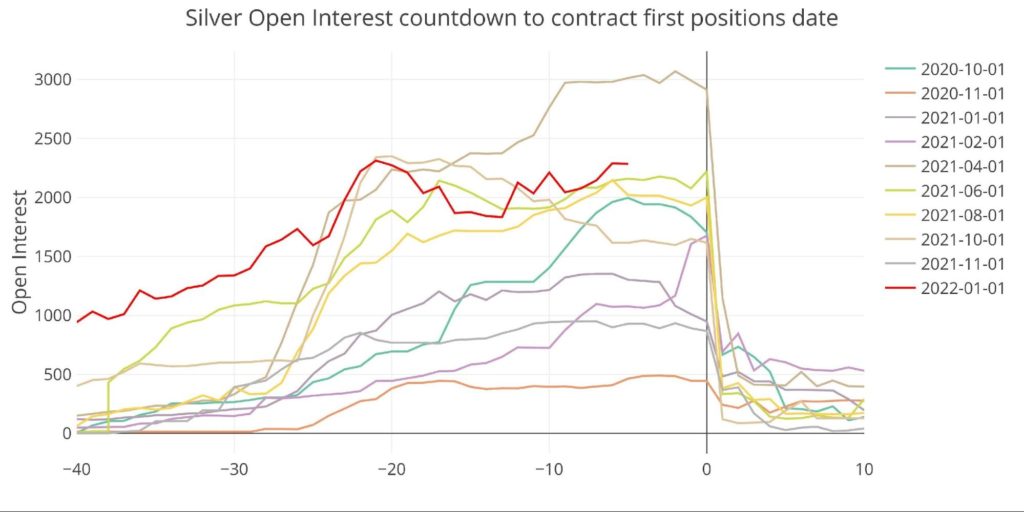
Figure: 5 Open Interest Countdown
The chart below shows the recent delivery data for the minor months. As shown by the orange dot, the minor months have been seeing more deliveries than the max open interest for the contract. If this trend holds, then January could be a pretty large delivery month relative to recent minor months.
Keep in mind that minor months are much smaller than major months as shown by Figure 2 above. That being said, seeing this type of strength in the minor months is a good sign for physical demand. Stay tuned next week to see how things look on First Notice.
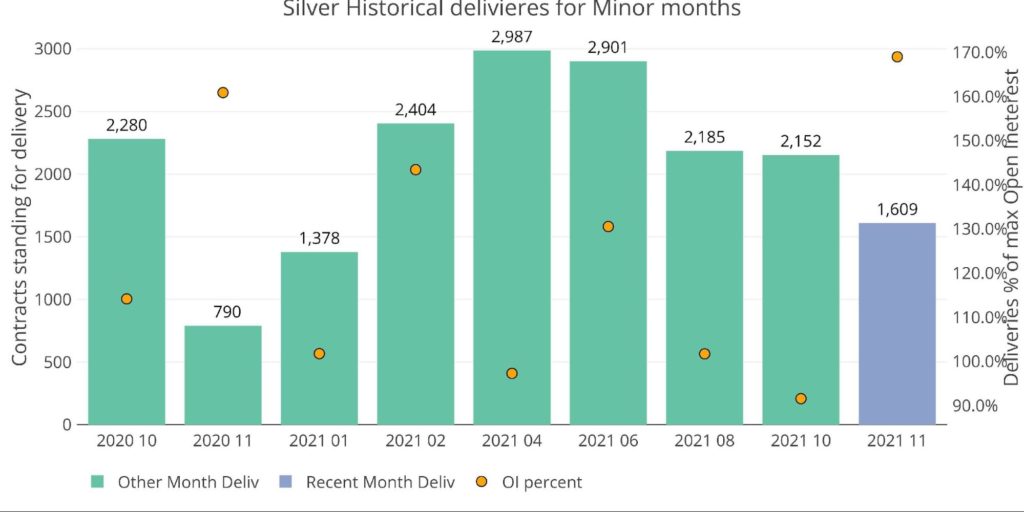
Figure: 6 Historical Deliveries
Gold: Recent Delivery Month
The charts below follow the same order as the silver charts above.
December gold has seen extremely strong delivery volume. With 35,589 contracts delivered, it will already be the second-largest delivery month since August of last year. There are 119 contracts still open, which is a number that has been in flux as more contracts have opened mid-month.
Total delivery represents 8.4% of the max open interest for the month. Aside for Octobers (which are odd months), this will be the highest open interest percentage since August 2020.
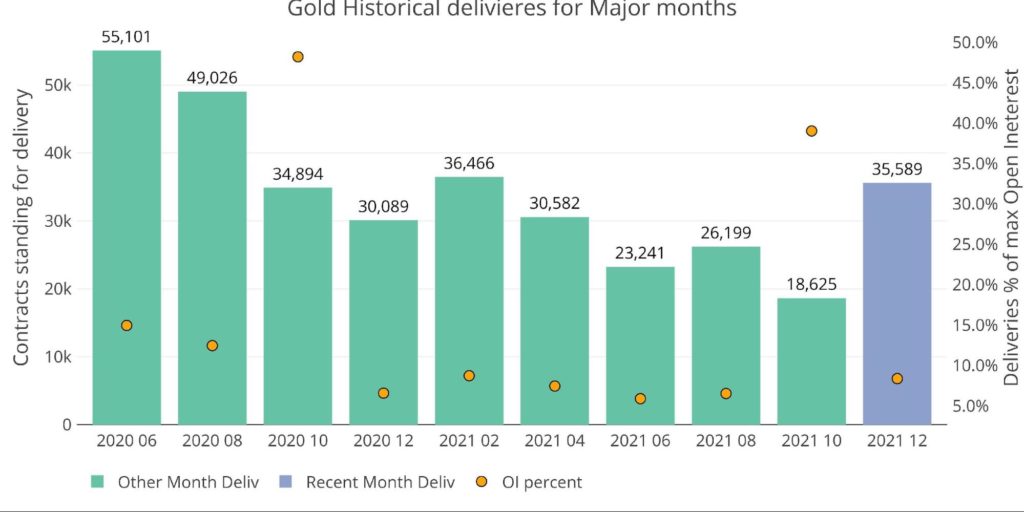
Figure: 7 Recent like-month delivery volume
Unlike silver, gold actually saw a large drop off in open interest on the final day leading up to First Position (difference between green and blue bars). Open interest fell from 48k to 31.5k on the final day.
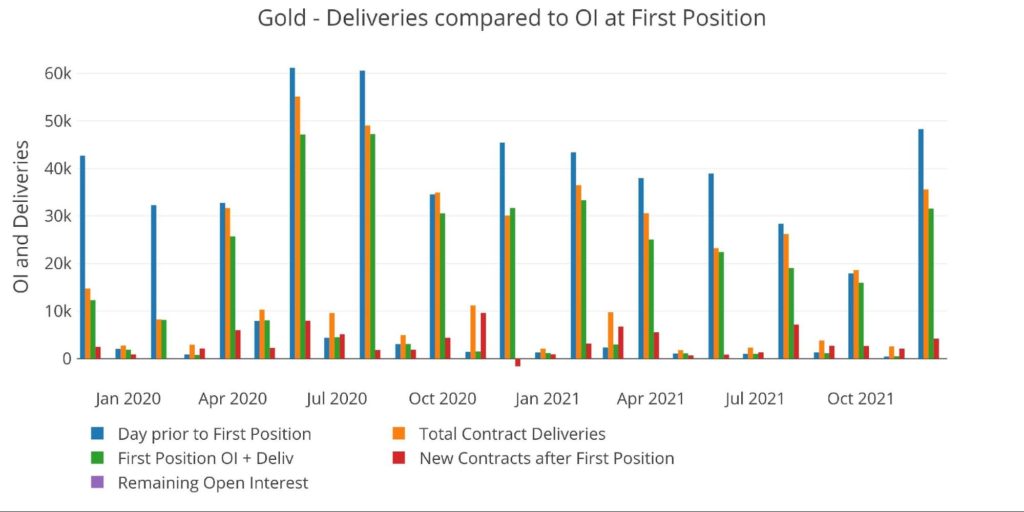
Figure: 8 24-month delivery and first notice
When looking at the contracts opened mid-month, the December month was very strong. Only a few months were better, and the current month is still trending upwards. Currently, 4.177 contracts have been opened mid-month. Perhaps even more impressive is that on the day after First Position, 1,037 contracts had actually been cash-settled (initial dip in red line). This means the number of contracts opened mid-month exceeds 5,000 all in. December showed a very large rebound compared to where it started the month.
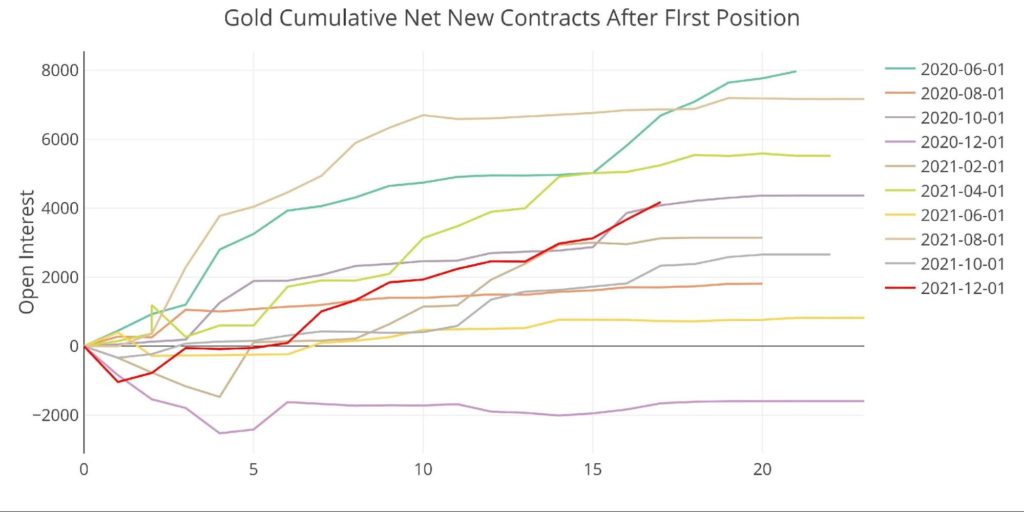
Figure: 9 Net New Contracts
Looking at December historically shows that it has been the largest December on record at $6.4B delivered with $21.5M outstanding!
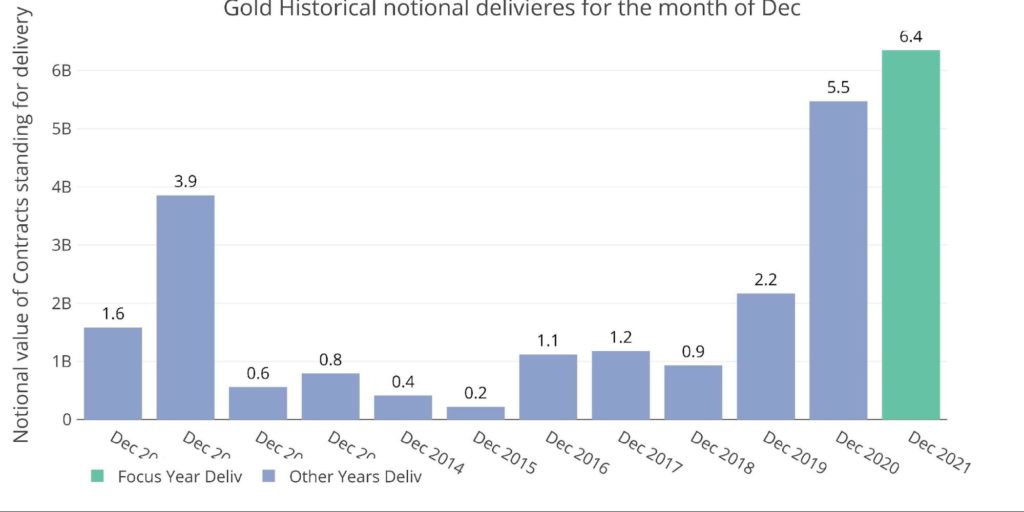
Figure: 10 Notional Deliveries
Gold: Next Delivery Month
January gold was looking very strong, similar to silver, but recently saw a drop in open interest. 600 contracts closed or rolled in the last trading day. This is surprising given the price increase seen yesterday. Price increases usually occur with open interest rising, which it did yesterday by 3k contracts. This makes the late move in rolling January even more confusing. Next week will reveal the final number posted on First Position.
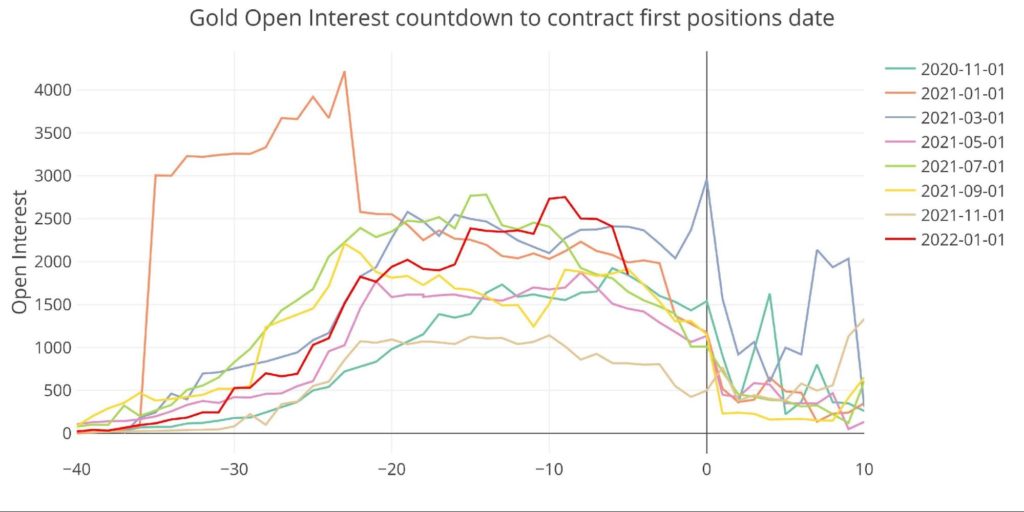
Figure: 11 Open Interest Countdown
Gold had been trending up for three minor months before the November month came in fairly low. November is an odd month, so it will be interesting to see if January shows strength similar to July and September. If current open interest holds and contracts are opened mid-month then January could be another sizable month relative to other minor months.
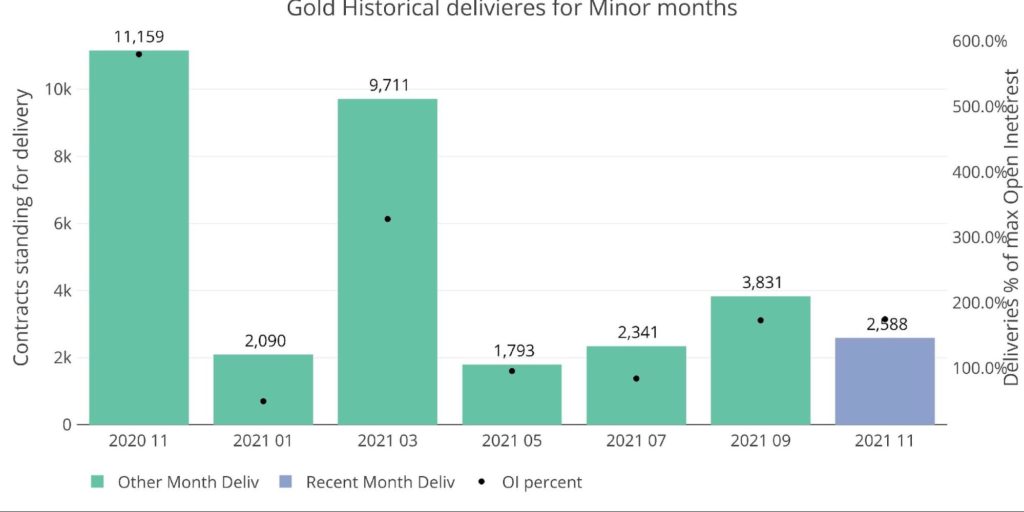
Figure: 12 Historical Deliveries
Wrapping up
December has proved to be a pretty big month for delivery in both gold and silver. Could this be laying the groundwork to start 2022 strong for precious metals? Maybe. Looking at the final chart below, 2021 was below the record deliveries seen in 2020, but still very strong by historical standards.
Given the current macro environment, which will probably lead to much higher gold and silver prices in the medium to long term, 2020 could be the new low watermark for delivery volume. This was a consolidation year in both metals after large run-ups. If prices start to move up again then delivery volume could definitely follow suit. Following this data will provide critical early signals that more investors are looking for physical metal and losing trust in the fiat system.
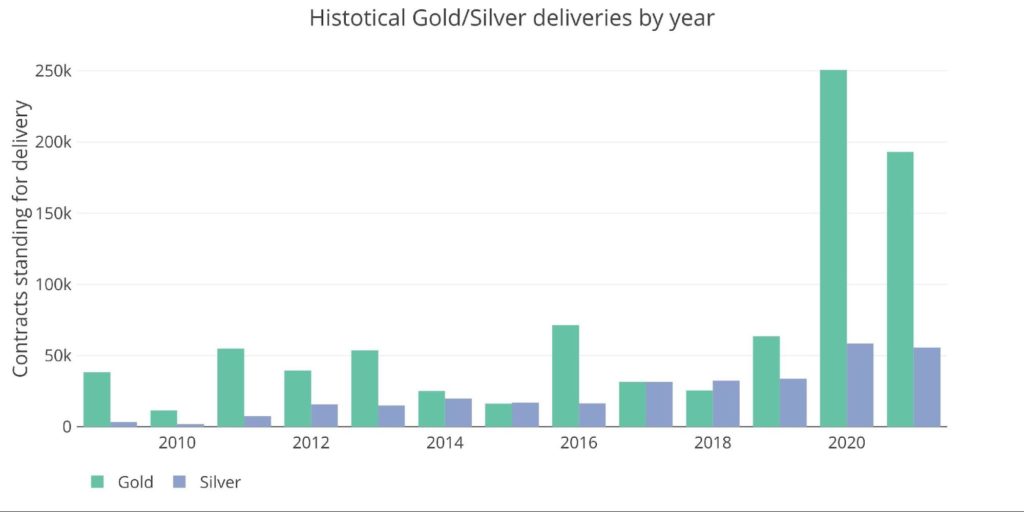
Figure: 13 Annual Deliveries
Data Source: https://www.cmegroup.com/
Data Updated: Nightly around 11 PM Eastern
Last Updated: Dec 22, 2021
Gold and Silver interactive charts and graphs can be found on the Exploring Finance dashboard: https://exploringfinance.shinyapps.io/goldsilver/

Call 1-888-GOLD-160 and speak with a Precious Metals Specialist today!
Buka akaun dagangan patuh syariah anda di Weltrade.
Source link